- Home >
- Stock Photos >
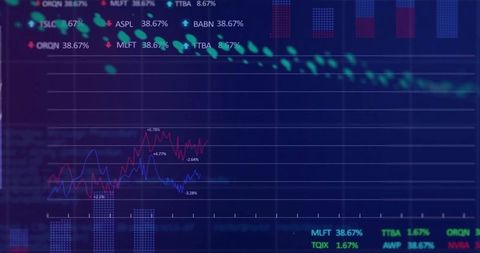
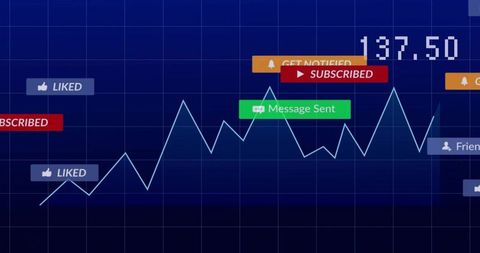
- Digital Data Processing Overlay with Technological Interface
Digital Data Processing Overlay with Technological Interface Image

A dynamic energy visual of complex data processing with graphical sequences suggesting real-time analytics and programming. Effective for illustrating concepts related to digital transformation, technological advancements, or data-centric professional presentations. Suitable for tech-related publications or websites focusing on contemporary computing solutions.

downloads
Tags:
More
Credit Photo
If you would like to credit the Photo, here are some ways you can do so
Text Link
photo Link
<span class="text-link">
<span>
<a target="_blank" href=https://pikwizard.com/photo/digital-data-processing-overlay-with-technological-interface/0b40bc2952d610d5b4ed12175aafad5c/>PikWizard</a>
</span>
</span>
<span class="image-link">
<span
style="margin: 0 0 20px 0; display: inline-block; vertical-align: middle; width: 100%;"
>
<a
target="_blank"
href="https://pikwizard.com/photo/digital-data-processing-overlay-with-technological-interface/0b40bc2952d610d5b4ed12175aafad5c/"
style="text-decoration: none; font-size: 10px; margin: 0;"
>
<img src="https://pikwizard.com/pw/medium/0b40bc2952d610d5b4ed12175aafad5c.jpg" style="margin: 0; width: 100%;" alt="" />
<p style="font-size: 12px; margin: 0;">PikWizard</p>
</a>
</span>
</span>
Free (free of charge)
Free for personal and commercial use.
Author: Creative Art