
- Home >
- Stock Photos >
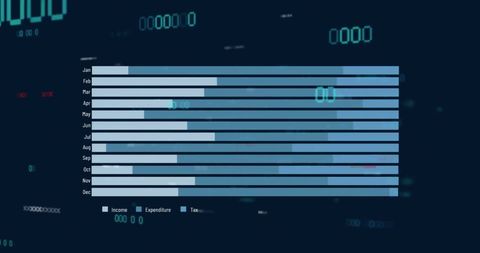
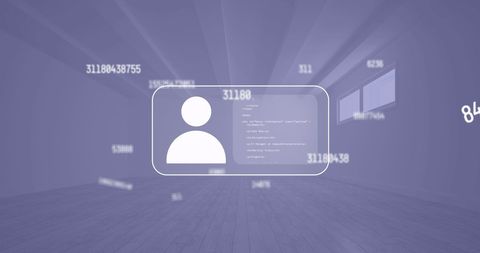
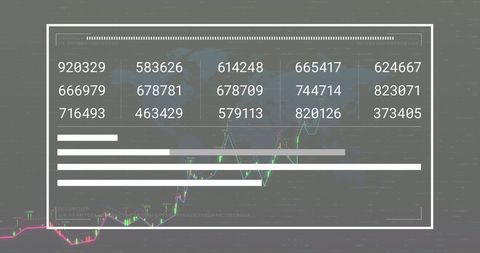
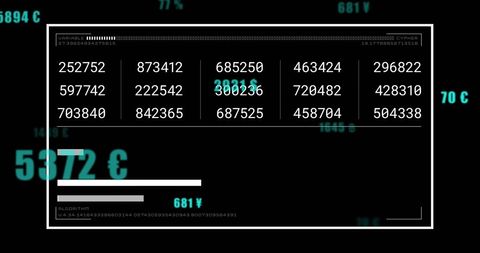
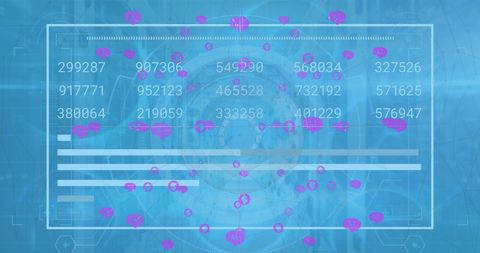
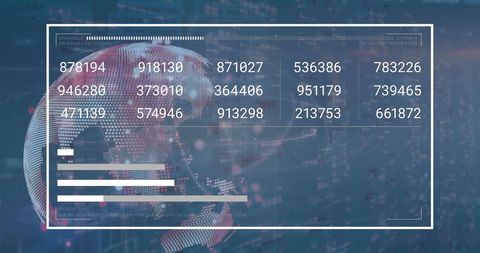
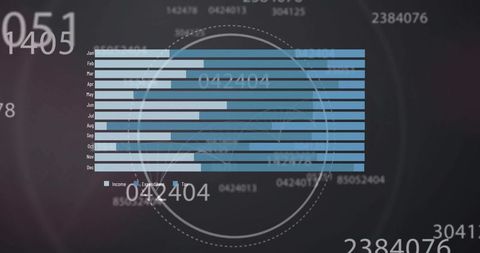
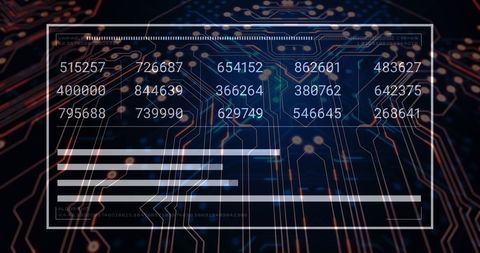
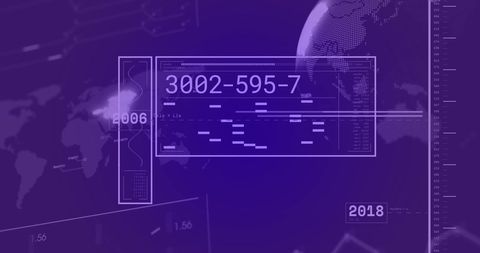
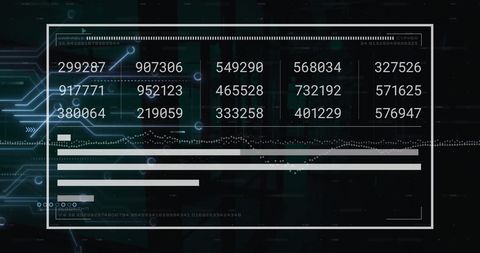
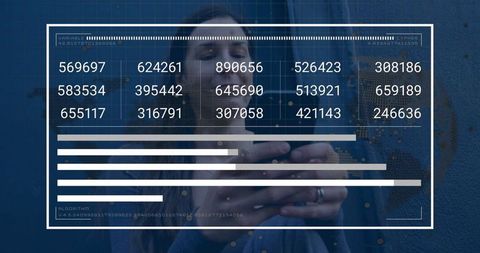
- Digital Data Processing Screen in Blue Tones
Digital Data Processing Screen in Blue Tones Image
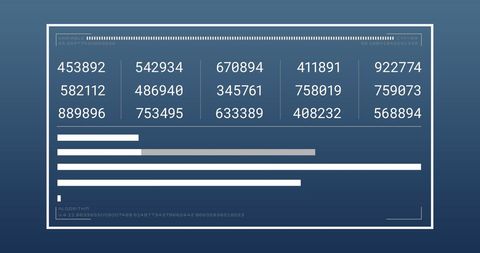
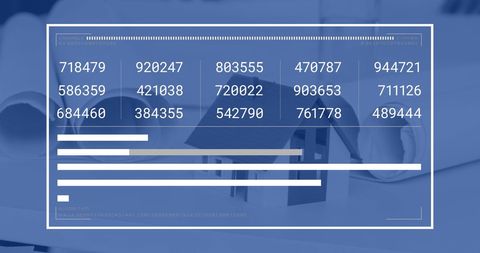
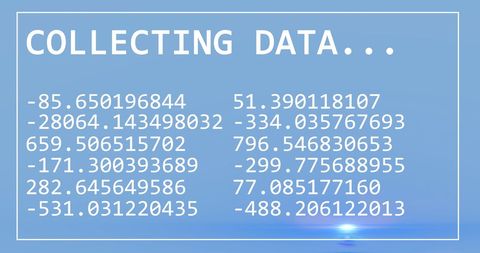
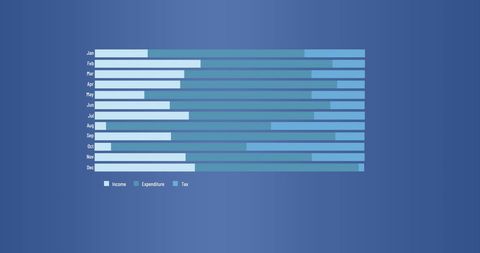
Numerical patterns are shown on a screen, symbolizing data processing activities often seen in finance and business analytics. The blue toned background adds a modern and sleek feel. Useful for presentations on global finance insights, business technology advancements, or technological data innovations.
Powered by 


downloads
Tags:
More
Credit Photo
If you would like to credit the Photo, here are some ways you can do so
Text Link
photo Link
<span class="text-link">
<span>
<a target="_blank" href=https://pikwizard.com/photo/digital-data-processing-screen-in-blue-tones/5d1ba237094d26527463241a80b94c65/>PikWizard</a>
</span>
</span>
<span class="image-link">
<span
style="margin: 0 0 20px 0; display: inline-block; vertical-align: middle; width: 100%;"
>
<a
target="_blank"
href="https://pikwizard.com/photo/digital-data-processing-screen-in-blue-tones/5d1ba237094d26527463241a80b94c65/"
style="text-decoration: none; font-size: 10px; margin: 0;"
>
<img src="https://pikwizard.com/pw/medium/5d1ba237094d26527463241a80b94c65.jpg" style="margin: 0; width: 100%;" alt="" />
<p style="font-size: 12px; margin: 0;">PikWizard</p>
</a>
</span>
</span>
Free (free of charge)
Free for personal and commercial use.
Author: Awesome Content
Similar Free Stock Images
Premium


Premium

Premium


Premium

Premium


Premium

Premium


Premium


Premium

Premium


Premium

Premium


Premium


Premium

Premium

Premium


Premium

Premium

Premium

Premium


Premium


Premium


Premium

Premium

Premium

Explore More Free Stock Images