
- Home >
- Stock Photos >
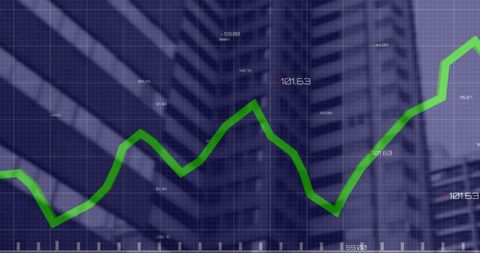
- Digital Data Processing with Abstract Financial Graph on Green Background
Digital Data Processing with Abstract Financial Graph on Green Background Image

Visual representation features multicolored lines resembling a financial graph set against a green backdrop interspersed with floating random numbers. Ideal for illustrating concepts related to data processing, financial analysis, technology trends, digital transformations in commerce, and global connections. Represents dynamic and complex digital environments often seen in stock trading or financial reports.
Powered by 


downloads
Tags:
More
Credit Photo
If you would like to credit the Photo, here are some ways you can do so
Text Link
photo Link
<span class="text-link">
<span>
<a target="_blank" href=https://pikwizard.com/photo/digital-data-processing-with-abstract-financial-graph-on-green-background/00e3e315f8434e1fe08f60f045e77dae/>PikWizard</a>
</span>
</span>
<span class="image-link">
<span
style="margin: 0 0 20px 0; display: inline-block; vertical-align: middle; width: 100%;"
>
<a
target="_blank"
href="https://pikwizard.com/photo/digital-data-processing-with-abstract-financial-graph-on-green-background/00e3e315f8434e1fe08f60f045e77dae/"
style="text-decoration: none; font-size: 10px; margin: 0;"
>
<img src="https://pikwizard.com/pw/medium/00e3e315f8434e1fe08f60f045e77dae.jpg" style="margin: 0; width: 100%;" alt="" />
<p style="font-size: 12px; margin: 0;">PikWizard</p>
</a>
</span>
</span>
Free (free of charge)
Free for personal and commercial use.
Author: People Creations
Similar Free Stock Images

Premium


Premium


Premium


Premium


Premium


Premium


Premium


Premium


Premium


Premium


Premium


Premium


Premium


Premium


Premium

Premium


Premium


Premium

Premium


Premium


Premium


Premium


Premium


Premium

Premium


Explore More Free Stock Images