- Home >
- Stock Photos >
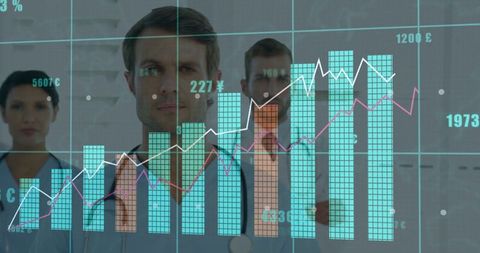
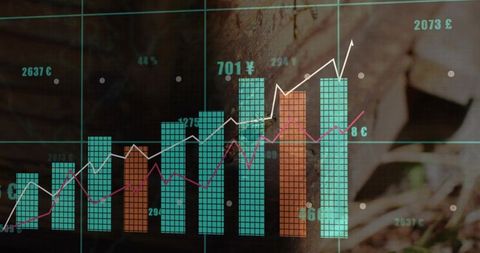
- Digital Data Processing with Animated Bar Graphs on Global Scale
Digital Data Processing with Animated Bar Graphs on Global Scale Image

Displaying animated bar graphs with currency symbols and fluctuating lines, representing data processing and global financial analysis. Ideal for illustrating concepts in finance, international business, and technological advancements. Useful for business presentation backgrounds or articles on economic trends.

downloads
Tags:
More
Credit Photo
If you would like to credit the Photo, here are some ways you can do so
Text Link
photo Link
<span class="text-link">
<span>
<a target="_blank" href=https://pikwizard.com/photo/digital-data-processing-with-animated-bar-graphs-on-global-scale/199a9e6a1941258b9f4dd5939e0040f8/>PikWizard</a>
</span>
</span>
<span class="image-link">
<span
style="margin: 0 0 20px 0; display: inline-block; vertical-align: middle; width: 100%;"
>
<a
target="_blank"
href="https://pikwizard.com/photo/digital-data-processing-with-animated-bar-graphs-on-global-scale/199a9e6a1941258b9f4dd5939e0040f8/"
style="text-decoration: none; font-size: 10px; margin: 0;"
>
<img src="https://pikwizard.com/pw/medium/199a9e6a1941258b9f4dd5939e0040f8.jpg" style="margin: 0; width: 100%;" alt="" />
<p style="font-size: 12px; margin: 0;">PikWizard</p>
</a>
</span>
</span>
Free (free of charge)
Free for personal and commercial use.
Author: People Creations