
- Home >
- Stock Photos >
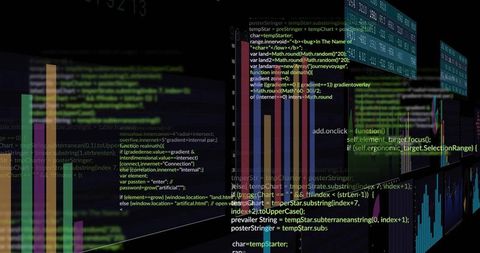
- Digital Data Processing with Bar and Line Graphs
Digital Data Processing with Bar and Line Graphs Image

Digital graphs, both bar and line, illuminated on a sleek black background, encompassing themes of technology and innovative data analysis. Perfect for illustrating topics related to computing, data analytics, and trendy global technological trends. Suitable for use in presentations, articles on data science, business reports, or promotional material for tech firms. The clean and modern appearance emphasizes futuristic and advanced concepts.
Powered by 


downloads
Tags:
More
Credit Photo
If you would like to credit the Photo, here are some ways you can do so
Text Link
photo Link
<span class="text-link">
<span>
<a target="_blank" href=https://pikwizard.com/photo/digital-data-processing-with-bar-and-line-graphs/2aa9657037344c88e105bcfbf143d376/>PikWizard</a>
</span>
</span>
<span class="image-link">
<span
style="margin: 0 0 20px 0; display: inline-block; vertical-align: middle; width: 100%;"
>
<a
target="_blank"
href="https://pikwizard.com/photo/digital-data-processing-with-bar-and-line-graphs/2aa9657037344c88e105bcfbf143d376/"
style="text-decoration: none; font-size: 10px; margin: 0;"
>
<img src="https://pikwizard.com/pw/medium/2aa9657037344c88e105bcfbf143d376.jpg" style="margin: 0; width: 100%;" alt="" />
<p style="font-size: 12px; margin: 0;">PikWizard</p>
</a>
</span>
</span>
Free (free of charge)
Free for personal and commercial use.
Author: Creative Art
Similar Free Stock Images

Premium


Premium


Premium


Premium


Premium


Premium


Premium


Premium


Premium


Premium


Premium


Premium


Premium


Premium


Premium


Premium


Premium


Premium

Premium


Premium


Premium

Premium


Premium


Premium


Premium


Explore More Free Stock Images