- Home >
- Stock Photos >
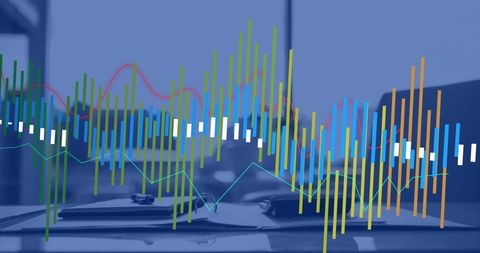
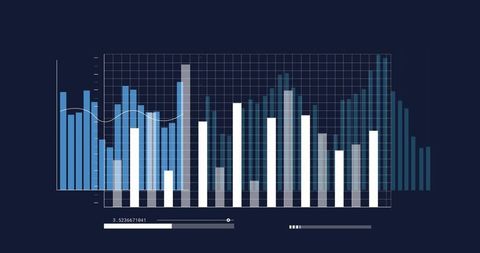
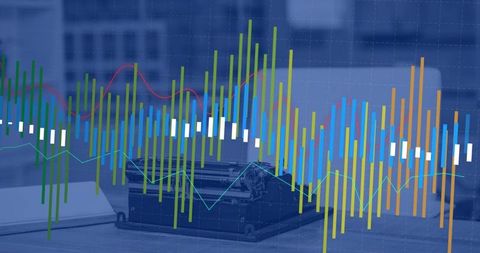
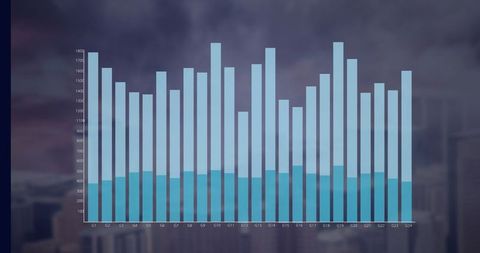
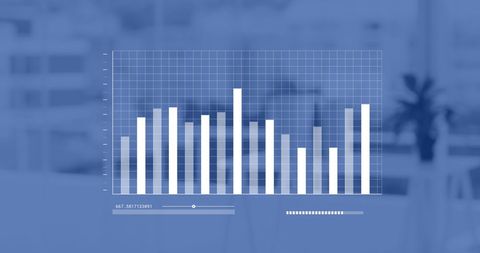
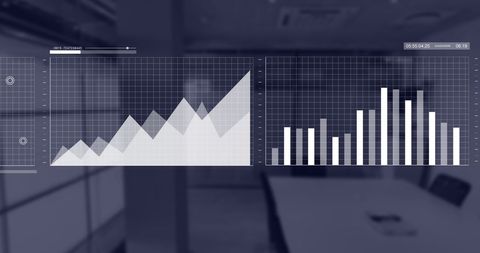
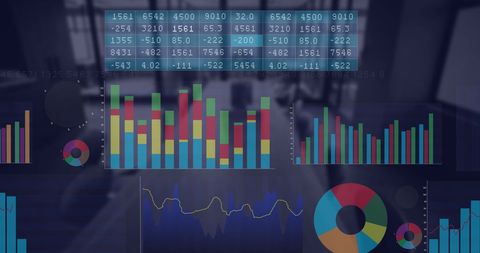
- Digital Data Processing with Bar Graph Interface in Office
Digital Data Processing with Bar Graph Interface in Office Image

Image showcases a digital bar graph superimposed over an office setting, representative of technological growth and data analysis in the business world. Use this for presentations on data science, articles on technological integration in business, or marketing materials highlighting digital advancements in analytics systems.

downloads
Tags:
More
Credit Photo
If you would like to credit the Photo, here are some ways you can do so
Text Link
photo Link
<span class="text-link">
<span>
<a target="_blank" href=https://pikwizard.com/photo/digital-data-processing-with-bar-graph-interface-in-office/2adf85fadd04f3f0ef236382a05ca7b7/>PikWizard</a>
</span>
</span>
<span class="image-link">
<span
style="margin: 0 0 20px 0; display: inline-block; vertical-align: middle; width: 100%;"
>
<a
target="_blank"
href="https://pikwizard.com/photo/digital-data-processing-with-bar-graph-interface-in-office/2adf85fadd04f3f0ef236382a05ca7b7/"
style="text-decoration: none; font-size: 10px; margin: 0;"
>
<img src="https://pikwizard.com/pw/medium/2adf85fadd04f3f0ef236382a05ca7b7.jpg" style="margin: 0; width: 100%;" alt="" />
<p style="font-size: 12px; margin: 0;">PikWizard</p>
</a>
</span>
</span>
Free (free of charge)
Free for personal and commercial use.
Author: Awesome Content