- Home >
- Stock Photos >
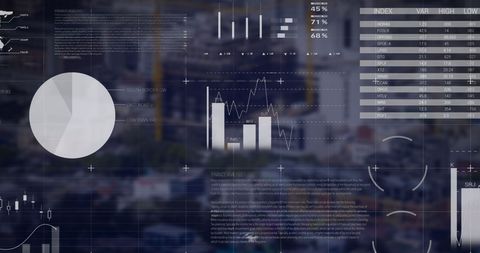
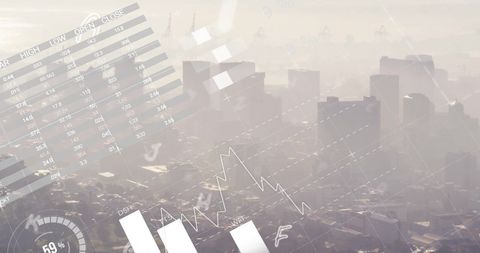
- Digital Data Processing with Business Graphs and Cityscape
Digital Data Processing with Business Graphs and Cityscape Image

This image depicts digital data processing with various business graphs and statistics overlaying a cityscape background. It illustrates the intersection of technology with urban development, highlighting analytical and futuristic elements. Ideal for use in financial presentations, business analysis content, and technology-forward corporate branding.

downloads
Tags:
More
Credit Photo
If you would like to credit the Photo, here are some ways you can do so
Text Link
photo Link
<span class="text-link">
<span>
<a target="_blank" href=https://pikwizard.com/photo/digital-data-processing-with-business-graphs-and-cityscape/5cb26336f316fb2b34eef8c3f7970325/>PikWizard</a>
</span>
</span>
<span class="image-link">
<span
style="margin: 0 0 20px 0; display: inline-block; vertical-align: middle; width: 100%;"
>
<a
target="_blank"
href="https://pikwizard.com/photo/digital-data-processing-with-business-graphs-and-cityscape/5cb26336f316fb2b34eef8c3f7970325/"
style="text-decoration: none; font-size: 10px; margin: 0;"
>
<img src="https://pikwizard.com/pw/medium/5cb26336f316fb2b34eef8c3f7970325.jpg" style="margin: 0; width: 100%;" alt="" />
<p style="font-size: 12px; margin: 0;">PikWizard</p>
</a>
</span>
</span>
Free (free of charge)
Free for personal and commercial use.
Author: Authentic Images