
- Home >
- Stock Photos >
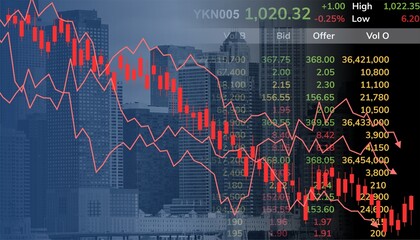
- Digital Data Processing with Diverse Business Professionals in Office
Digital Data Processing with Diverse Business Professionals in Office Image

Visual shows diverse business professionals in an office setting highlighted by an overlay of financial data graphs. This image illustrates concepts of global finance, team collaboration, and modern data processing in the digital age. It can be used for finance-related promotions, business presentations, and articles focused on diversity and teamwork in technology-driven environments.
Powered by 


downloads
Tags:
More
Credit Photo
If you would like to credit the Photo, here are some ways you can do so
Text Link
photo Link
<span class="text-link">
<span>
<a target="_blank" href=https://pikwizard.com/photo/digital-data-processing-with-diverse-business-professionals-in-office/09194d0ae44e1db44315c5b4809c318b/>PikWizard</a>
</span>
</span>
<span class="image-link">
<span
style="margin: 0 0 20px 0; display: inline-block; vertical-align: middle; width: 100%;"
>
<a
target="_blank"
href="https://pikwizard.com/photo/digital-data-processing-with-diverse-business-professionals-in-office/09194d0ae44e1db44315c5b4809c318b/"
style="text-decoration: none; font-size: 10px; margin: 0;"
>
<img src="https://pikwizard.com/pw/medium/09194d0ae44e1db44315c5b4809c318b.jpg" style="margin: 0; width: 100%;" alt="" />
<p style="font-size: 12px; margin: 0;">PikWizard</p>
</a>
</span>
</span>
Free (free of charge)
Free for personal and commercial use.
Author: People Creations
Similar Free Stock Images

Premium


Premium


Premium


Premium


Premium


Premium
Premium


Premium


Premium

Premium

Premium

Premium


Premium


Premium

Premium


Premium

Premium


Premium


Premium


Premium


Premium


Premium


Premium

Premium


Premium

Explore More Free Stock Images