
- Home >
- Stock Photos >
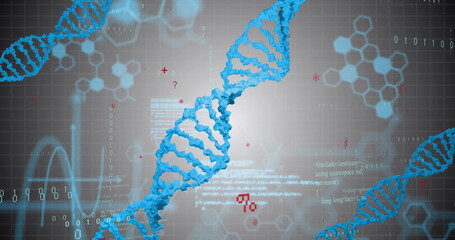
- Digital Data Processing with DNA Helix Overlay
Digital Data Processing with DNA Helix Overlay Image

Visualization showing a digital DNA helix across data bars and lines, representing interconnected data and technology in computing and genome studies. Perfect for illustrating themes of big data analysis, tech advancements, and scientific research. Useful for educational materials, scientific articles, or digital transformation concepts.
Powered by 


downloads
Tags:
More
Credit Photo
If you would like to credit the Photo, here are some ways you can do so
Text Link
photo Link
<span class="text-link">
<span>
<a target="_blank" href=https://pikwizard.com/photo/digital-data-processing-with-dna-helix-overlay/b5af57ca508f1dba3152396b24c93b42/>PikWizard</a>
</span>
</span>
<span class="image-link">
<span
style="margin: 0 0 20px 0; display: inline-block; vertical-align: middle; width: 100%;"
>
<a
target="_blank"
href="https://pikwizard.com/photo/digital-data-processing-with-dna-helix-overlay/b5af57ca508f1dba3152396b24c93b42/"
style="text-decoration: none; font-size: 10px; margin: 0;"
>
<img src="https://pikwizard.com/pw/medium/b5af57ca508f1dba3152396b24c93b42.jpg" style="margin: 0; width: 100%;" alt="" />
<p style="font-size: 12px; margin: 0;">PikWizard</p>
</a>
</span>
</span>
Free (free of charge)
Free for personal and commercial use.
Author: People Creations
Similar Free Stock Images

Premium

Premium


Premium

Premium
Premium


Premium


Premium


Premium


Premium


Premium


Premium


Premium

Premium


Premium


Premium


Premium

Premium


Premium

Premium

Premium


Premium

Premium

Premium


Premium


Premium


Explore More Free Stock Images