- Home >
- Stock Photos >
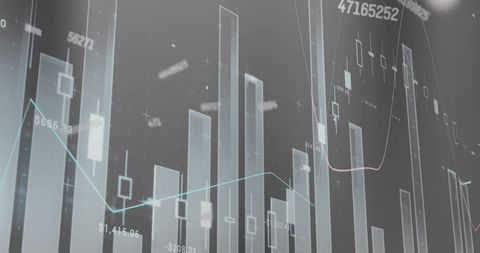
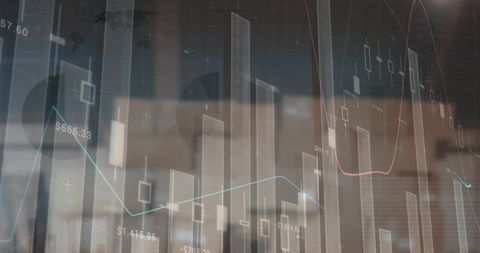
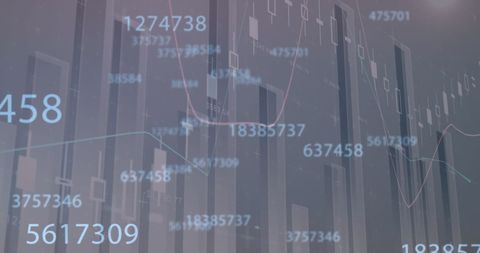
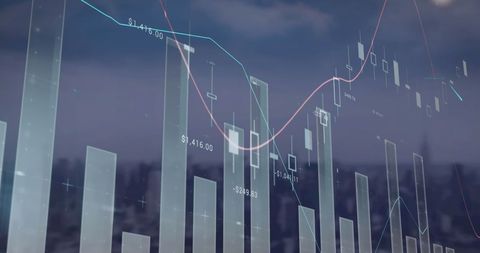
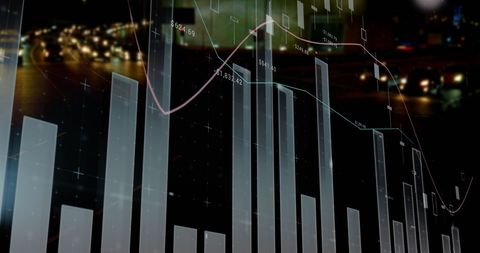
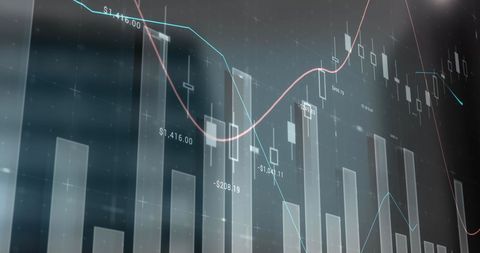
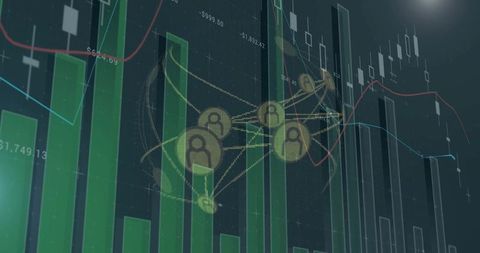
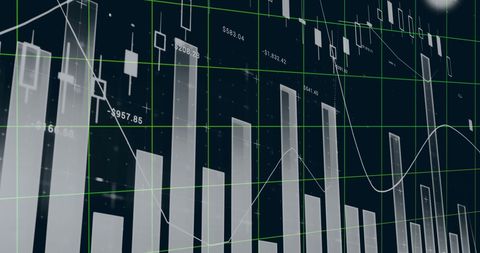
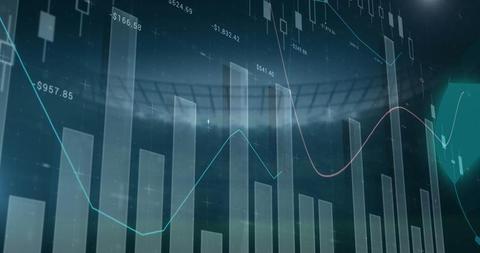
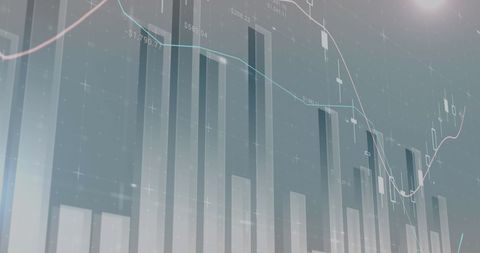
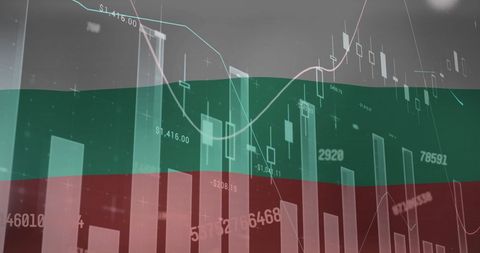
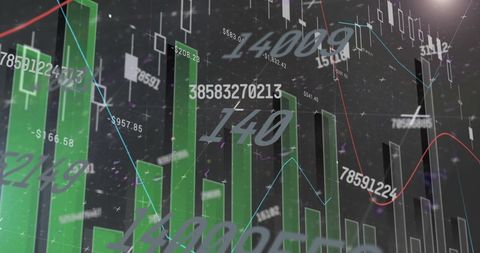
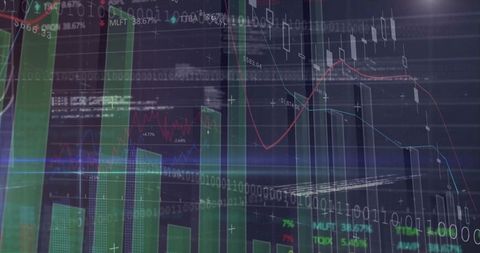
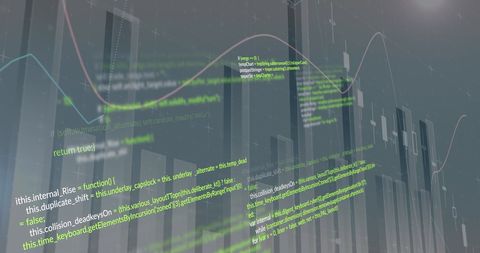
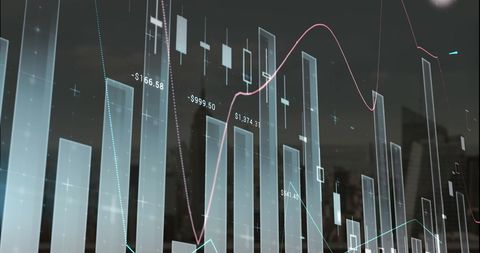
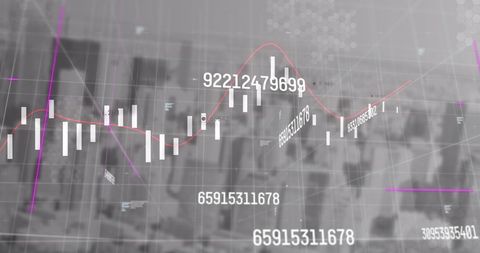
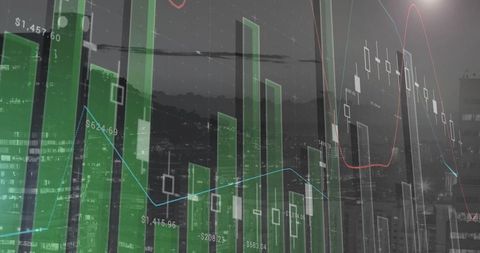
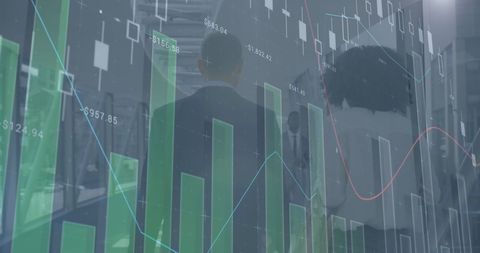
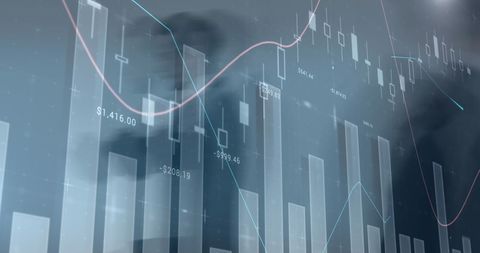
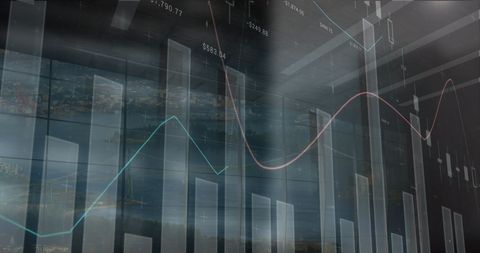
- Digital Data Processing with Financial Diagrams
Digital Data Processing with Financial Diagrams Image

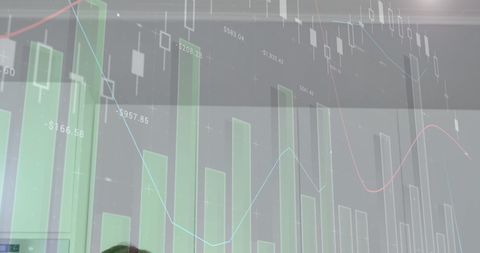
Green candlestick charts and numerical data analyzes are overlaid on a gray background, simulating real-time financial analysis and data processing. Ideal for illustrating concepts in global business, technology advancements in finance, or highlighting digital strategies in economic planning. Useful in presentations, financial reports, or articles focused on market trends and digital analysis innovations.

downloads
Tags:
More
Credit Photo
If you would like to credit the Photo, here are some ways you can do so
Text Link
photo Link
<span class="text-link">
<span>
<a target="_blank" href=https://pikwizard.com/photo/digital-data-processing-with-financial-diagrams/a7e6f61b68d2a511fcc44e11c34801fd/>PikWizard</a>
</span>
</span>
<span class="image-link">
<span
style="margin: 0 0 20px 0; display: inline-block; vertical-align: middle; width: 100%;"
>
<a
target="_blank"
href="https://pikwizard.com/photo/digital-data-processing-with-financial-diagrams/a7e6f61b68d2a511fcc44e11c34801fd/"
style="text-decoration: none; font-size: 10px; margin: 0;"
>
<img src="https://pikwizard.com/pw/medium/a7e6f61b68d2a511fcc44e11c34801fd.jpg" style="margin: 0; width: 100%;" alt="" />
<p style="font-size: 12px; margin: 0;">PikWizard</p>
</a>
</span>
</span>
Free (free of charge)
Free for personal and commercial use.
Author: Awesome Content