
- Home >
- Stock Photos >
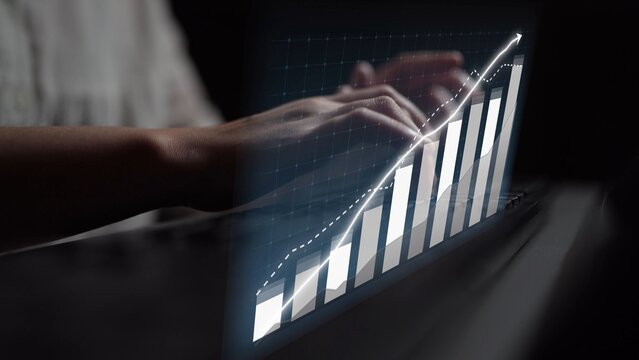
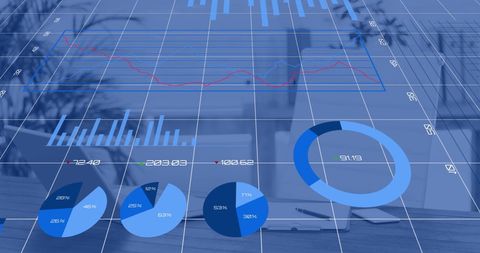
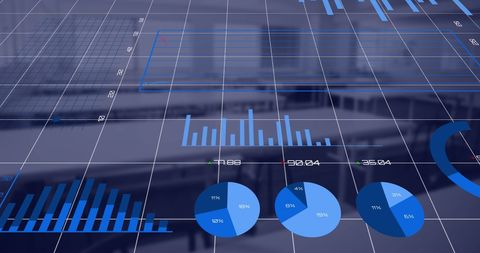
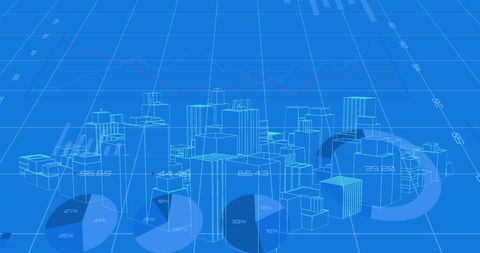
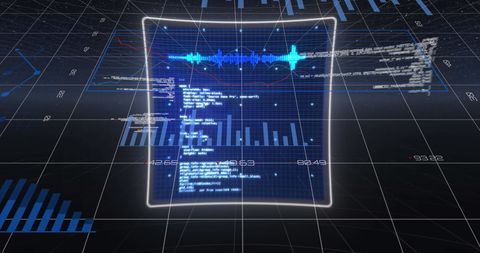
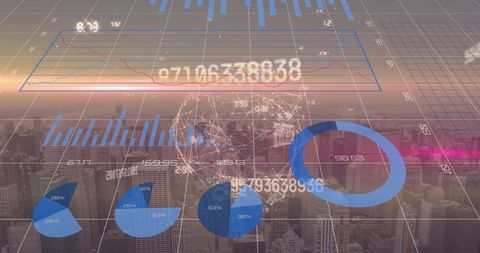
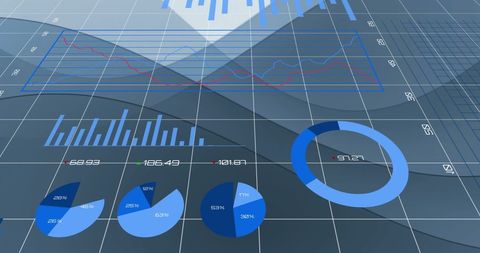
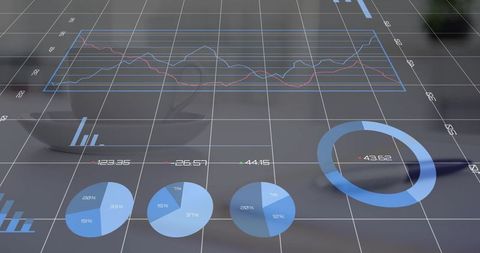
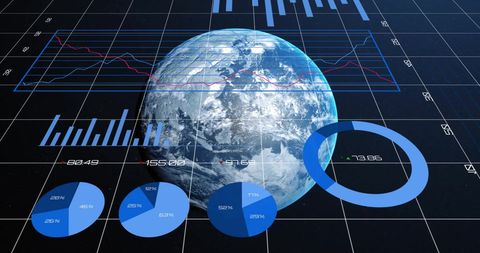
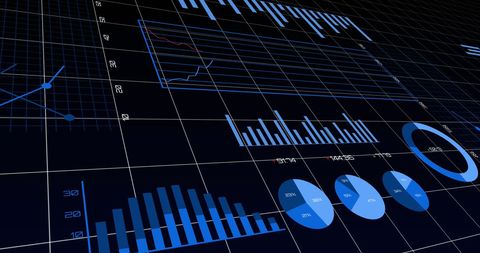
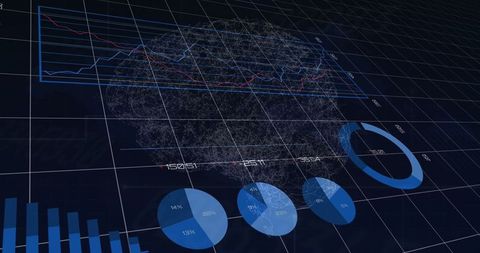
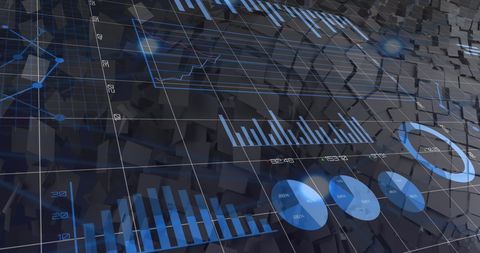
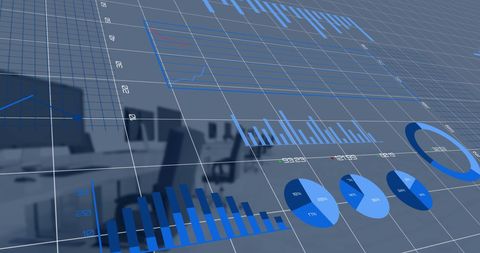
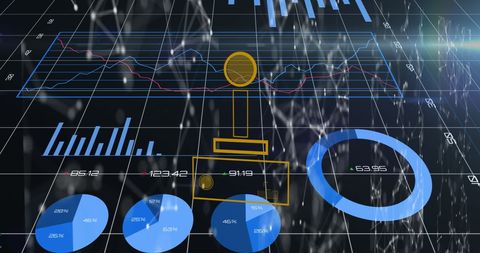
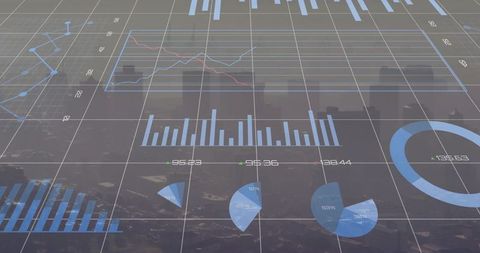
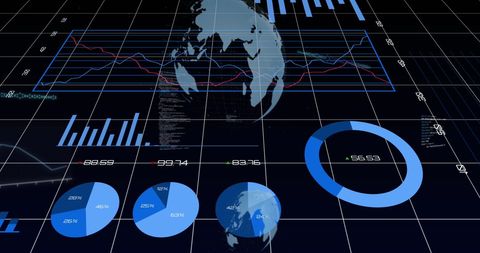
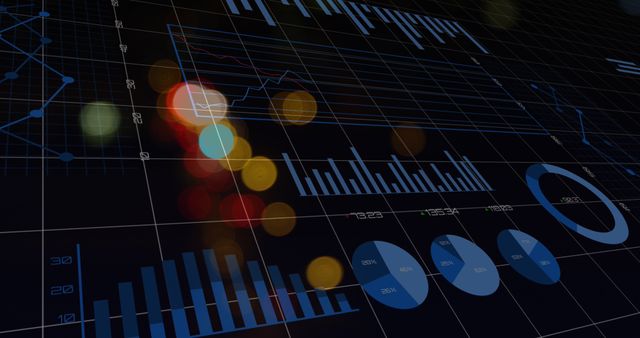
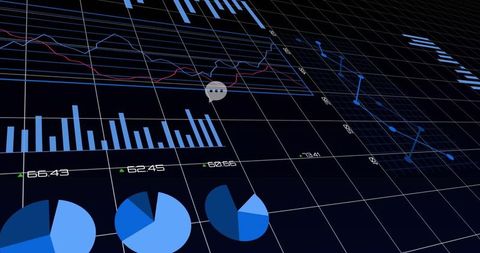
- Digital Data Processing with Financial Graphs and Charts
Digital Data Processing with Financial Graphs and Charts Image

Digital representation of data processing, showcasing financial graphs, charts, and analytics viewed over a computer server environment. Useful for illustrating concepts related to data analysis, global technology integration, and financial computation in business presentations, educational materials, or online content about data science and modern computing advancements.
Powered by 


downloads
Tags:
More
Credit Photo
If you would like to credit the Photo, here are some ways you can do so
Text Link
photo Link
<span class="text-link">
<span>
<a target="_blank" href=https://pikwizard.com/photo/digital-data-processing-with-financial-graphs-and-charts/a2c9b351d2cd6e2d1edfd9725f9b0226/>PikWizard</a>
</span>
</span>
<span class="image-link">
<span
style="margin: 0 0 20px 0; display: inline-block; vertical-align: middle; width: 100%;"
>
<a
target="_blank"
href="https://pikwizard.com/photo/digital-data-processing-with-financial-graphs-and-charts/a2c9b351d2cd6e2d1edfd9725f9b0226/"
style="text-decoration: none; font-size: 10px; margin: 0;"
>
<img src="https://pikwizard.com/pw/medium/a2c9b351d2cd6e2d1edfd9725f9b0226.jpg" style="margin: 0; width: 100%;" alt="" />
<p style="font-size: 12px; margin: 0;">PikWizard</p>
</a>
</span>
</span>
Free (free of charge)
Free for personal and commercial use.
Author: People Creations
Similar Free Stock Images

Premium


Premium

Premium


Premium


Premium


Premium


Premium

Premium

Premium

Premium


Premium

Premium

Premium


Premium


Premium


Premium


Premium


Premium

Premium

Premium

Premium


Premium

Premium


Premium


Premium


Explore More Free Stock Images