- Home >
- Stock Photos >
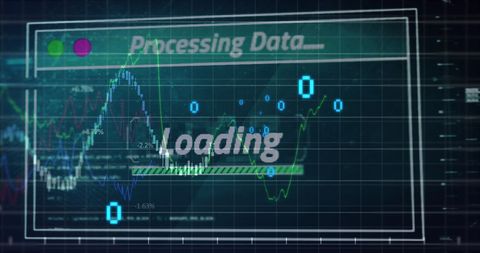
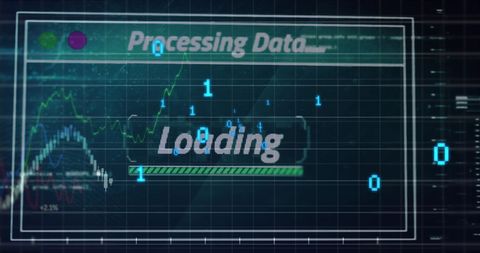
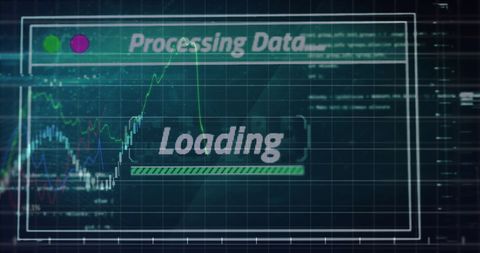
- Digital Data Processing with Futuristic Interface and Loading Bar
Digital Data Processing with Futuristic Interface and Loading Bar Image

This image depicts a futuristic digital interface with bright neon and a conceptual grid symbolizing data processing and technology connections. The visual focus is on a dynamic loading bar, enhancing themes of progress and digital advancement. Suitable for presentations or articles related to technology advancements, data analytics, software development, and global connectivity.

downloads
Tags:
More
Credit Photo
If you would like to credit the Photo, here are some ways you can do so
Text Link
photo Link
<span class="text-link">
<span>
<a target="_blank" href=https://pikwizard.com/photo/digital-data-processing-with-futuristic-interface-and-loading-bar/23c1dfc5a6710f246ba8e55a35e1bd09/>PikWizard</a>
</span>
</span>
<span class="image-link">
<span
style="margin: 0 0 20px 0; display: inline-block; vertical-align: middle; width: 100%;"
>
<a
target="_blank"
href="https://pikwizard.com/photo/digital-data-processing-with-futuristic-interface-and-loading-bar/23c1dfc5a6710f246ba8e55a35e1bd09/"
style="text-decoration: none; font-size: 10px; margin: 0;"
>
<img src="https://pikwizard.com/pw/medium/23c1dfc5a6710f246ba8e55a35e1bd09.jpg" style="margin: 0; width: 100%;" alt="" />
<p style="font-size: 12px; margin: 0;">PikWizard</p>
</a>
</span>
</span>
Free (free of charge)
Free for personal and commercial use.
Author: People Creations