
- Home >
- Stock Photos >
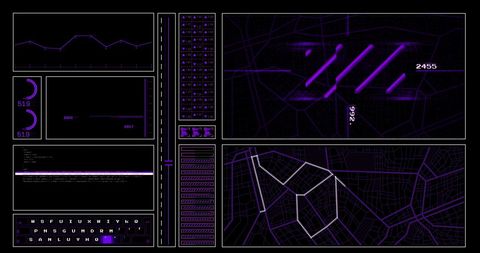
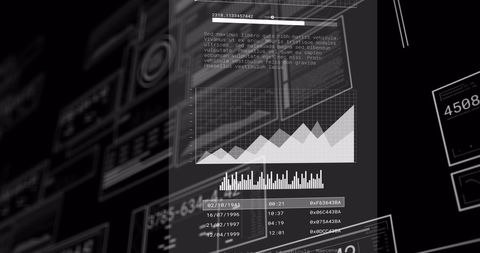
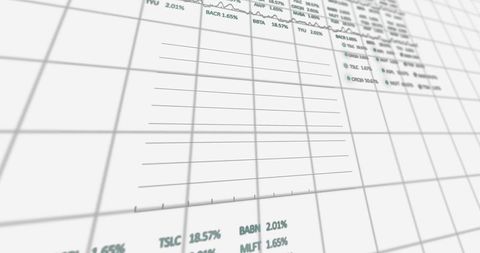
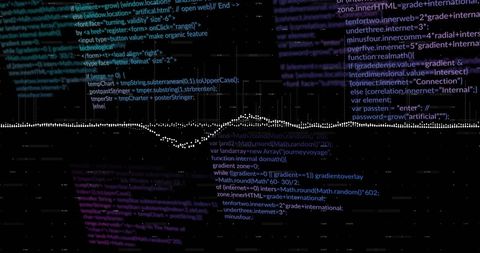
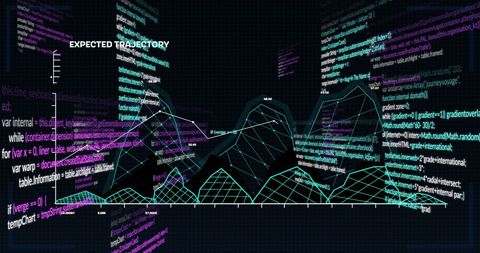
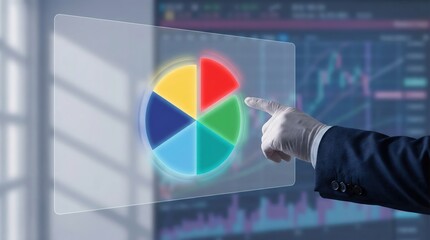
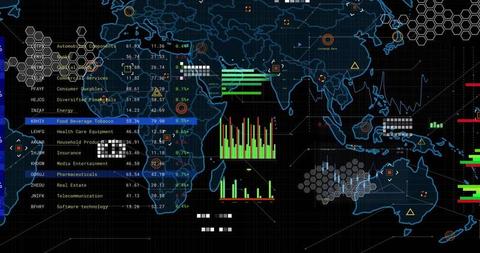
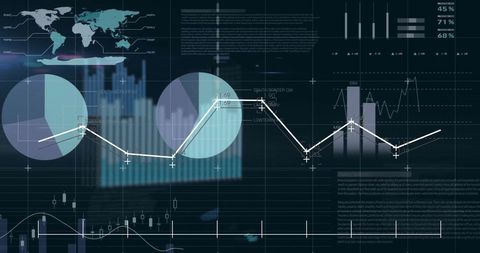
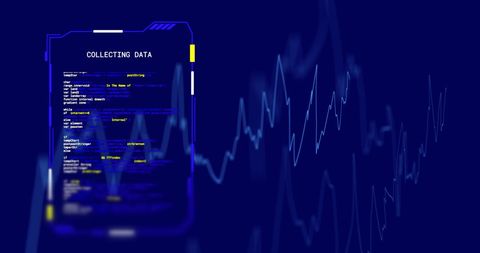
- Digital Data Processing with Futuristic Pie Chart Display
Digital Data Processing with Futuristic Pie Chart Display Image

Depicts a high-tech digital data processing scenario with a futuristic pie chart overlay. Ideal for use in IT industry material, educational content focusing on data analytics, or technology blogs showcasing modern computing interfaces. Highlights efficiency and global data connectivity.
Powered by 


downloads
Tags:
More
Credit Photo
If you would like to credit the Photo, here are some ways you can do so
Text Link
photo Link
<span class="text-link">
<span>
<a target="_blank" href=https://pikwizard.com/photo/digital-data-processing-with-futuristic-pie-chart-display/35836fbd0ac3026149c9a3d8337356e4/>PikWizard</a>
</span>
</span>
<span class="image-link">
<span
style="margin: 0 0 20px 0; display: inline-block; vertical-align: middle; width: 100%;"
>
<a
target="_blank"
href="https://pikwizard.com/photo/digital-data-processing-with-futuristic-pie-chart-display/35836fbd0ac3026149c9a3d8337356e4/"
style="text-decoration: none; font-size: 10px; margin: 0;"
>
<img src="https://pikwizard.com/pw/medium/35836fbd0ac3026149c9a3d8337356e4.jpg" style="margin: 0; width: 100%;" alt="" />
<p style="font-size: 12px; margin: 0;">PikWizard</p>
</a>
</span>
</span>
Free (free of charge)
Free for personal and commercial use.
Author: Awesome Content
Similar Free Stock Images

Premium


Premium

Premium


Premium


Premium


Premium


Premium

Premium


Premium


Premium


Premium


Premium


Premium


Premium


Premium


Premium


Premium


Premium


Premium


Premium


Premium


Premium


Premium


Premium


Premium

Explore More Free Stock Images