- Home >
- Stock Photos >
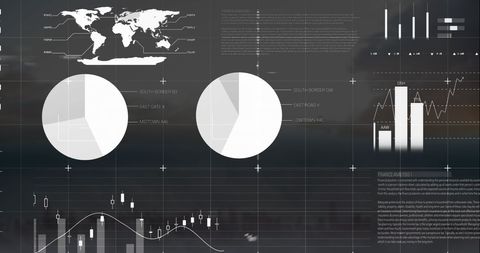
- Digital Data Processing with Graphs and Maps Interface
Digital Data Processing with Graphs and Maps Interface Image

Visual representation of digital data and statistics on a virtual screen with graphs, charts, and world maps. Useful for technology, data analysis, and global communication themes. Ideal for presentations, blogs, and articles on digital analytics and information technology.

downloads
Tags:
More
Credit Photo
If you would like to credit the Photo, here are some ways you can do so
Text Link
photo Link
<span class="text-link">
<span>
<a target="_blank" href=https://pikwizard.com/photo/digital-data-processing-with-graphs-and-maps-interface/2367e2443f041009c595faee10846215/>PikWizard</a>
</span>
</span>
<span class="image-link">
<span
style="margin: 0 0 20px 0; display: inline-block; vertical-align: middle; width: 100%;"
>
<a
target="_blank"
href="https://pikwizard.com/photo/digital-data-processing-with-graphs-and-maps-interface/2367e2443f041009c595faee10846215/"
style="text-decoration: none; font-size: 10px; margin: 0;"
>
<img src="https://pikwizard.com/pw/medium/2367e2443f041009c595faee10846215.jpg" style="margin: 0; width: 100%;" alt="" />
<p style="font-size: 12px; margin: 0;">PikWizard</p>
</a>
</span>
</span>
Free (free of charge)
Free for personal and commercial use.
Author: Awesome Content