- Home >
- Stock Photos >
- Digital Data Processing with Graphs and Numbers
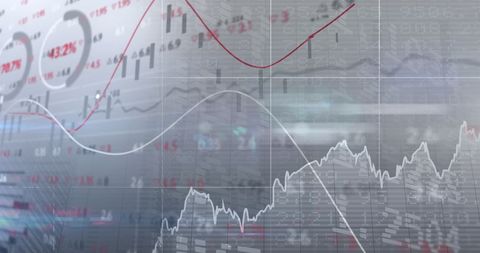
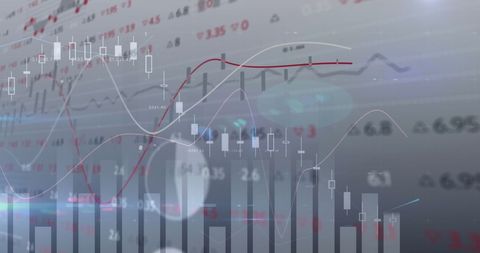
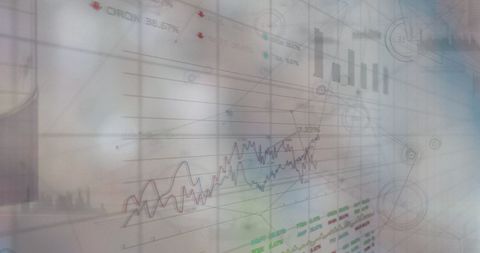
Digital Data Processing with Graphs and Numbers Image
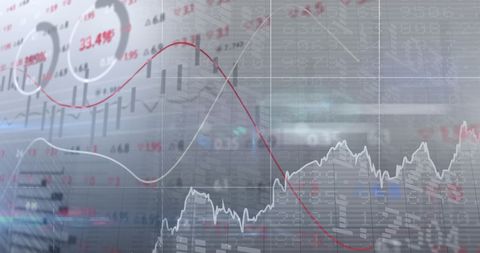
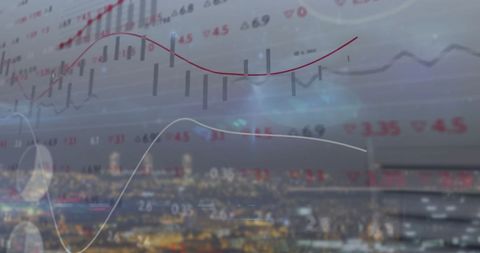
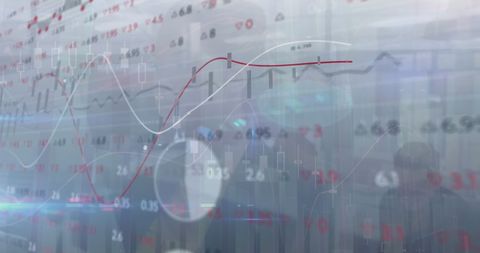
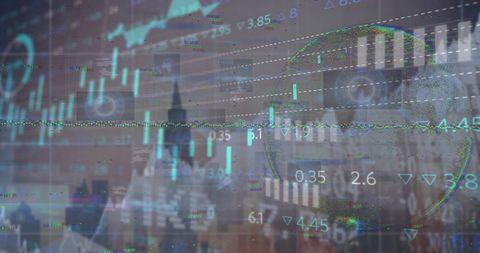
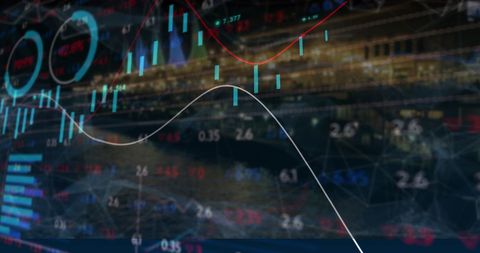
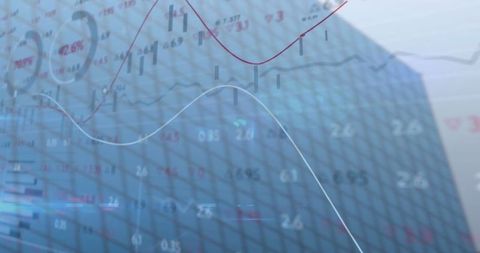
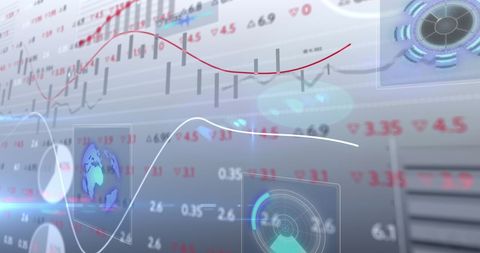
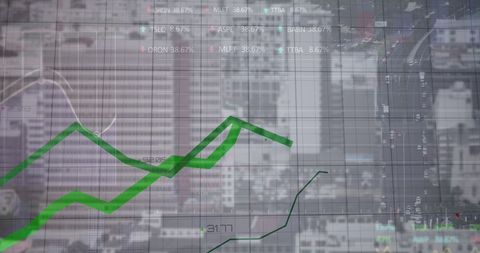
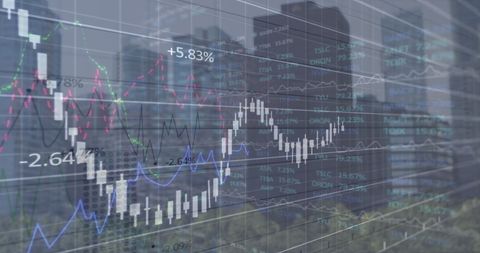
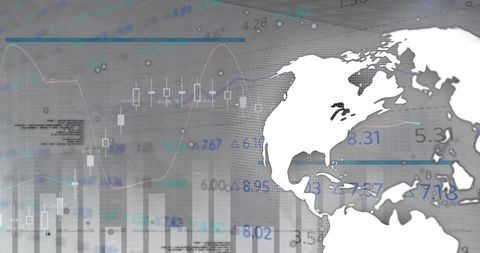
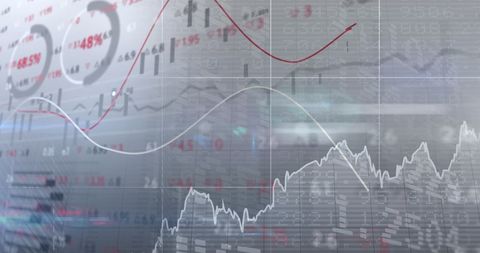
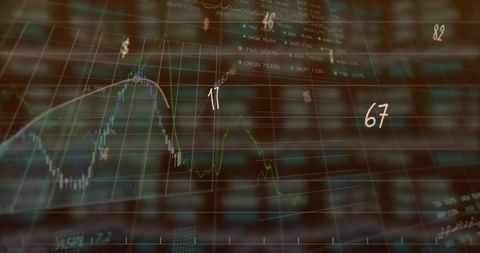
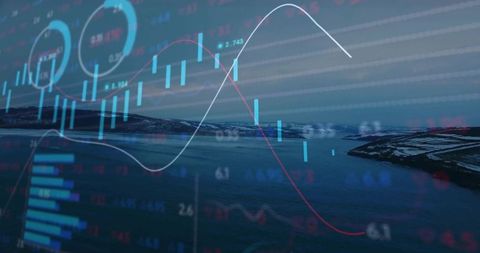
Presents digital data and analytics with overlapping graphs and numeric data indicating business trends. This visual can be used in promotions related to finance or analytics, articles or content discussing global economics or data science, and corporate presentations about market research and data analysis.

downloads
Tags:
More
Credit Photo
If you would like to credit the Photo, here are some ways you can do so
Text Link
photo Link
<span class="text-link">
<span>
<a target="_blank" href=https://pikwizard.com/photo/digital-data-processing-with-graphs-and-numbers/1bf8085b928d1e38c2d8dcd4a1ebaba8/>PikWizard</a>
</span>
</span>
<span class="image-link">
<span
style="margin: 0 0 20px 0; display: inline-block; vertical-align: middle; width: 100%;"
>
<a
target="_blank"
href="https://pikwizard.com/photo/digital-data-processing-with-graphs-and-numbers/1bf8085b928d1e38c2d8dcd4a1ebaba8/"
style="text-decoration: none; font-size: 10px; margin: 0;"
>
<img src="https://pikwizard.com/pw/medium/1bf8085b928d1e38c2d8dcd4a1ebaba8.jpg" style="margin: 0; width: 100%;" alt="" />
<p style="font-size: 12px; margin: 0;">PikWizard</p>
</a>
</span>
</span>
Free (free of charge)
Free for personal and commercial use.
Author: Authentic Images