
- Home >
- Stock Photos >
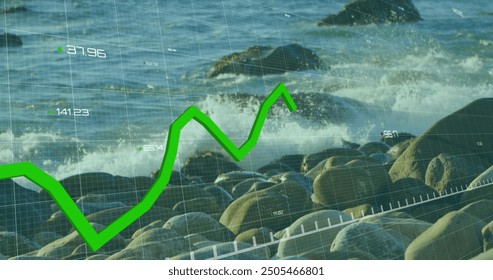
- Digital Data Processing with Green Statistical Graph
Digital Data Processing with Green Statistical Graph Image

Visual representing technical data analysis with green line charts and blue overlays, suitable for illustrating concepts of digital processing, technology strategies, analytics, and tech innovation. Ideal for use in presentations, articles on data science, and stock images for financial or tech publications.
Powered by  - Get 15% off with code: PIKWIZARD15


downloads
Tags:
More
Credit Photo
If you would like to credit the Photo, here are some ways you can do so
Text Link
photo Link
<span class="text-link">
<span>
<a target="_blank" href=https://pikwizard.com/photo/digital-data-processing-with-green-statistical-graph/fee8426ef33e6c01fd6f4ca4526245d2/>PikWizard</a>
</span>
</span>
<span class="image-link">
<span
style="margin: 0 0 20px 0; display: inline-block; vertical-align: middle; width: 100%;"
>
<a
target="_blank"
href="https://pikwizard.com/photo/digital-data-processing-with-green-statistical-graph/fee8426ef33e6c01fd6f4ca4526245d2/"
style="text-decoration: none; font-size: 10px; margin: 0;"
>
<img src="https://pikwizard.com/pw/medium/fee8426ef33e6c01fd6f4ca4526245d2.jpg" style="margin: 0; width: 100%;" alt="" />
<p style="font-size: 12px; margin: 0;">PikWizard</p>
</a>
</span>
</span>
Free (free of charge)
Free for personal and commercial use.
Author: People Creations
Similar Free Stock Images

Premium


Premium

Premium


Premium


Premium


Premium


Premium


Premium

Premium

Premium

Premium


Premium


Premium


Premium


Premium


Premium


Premium


Premium


Premium


Premium


Premium

Premium


Premium


Premium


Premium


Explore More Free Stock Images