
- Home >
- Stock Photos >
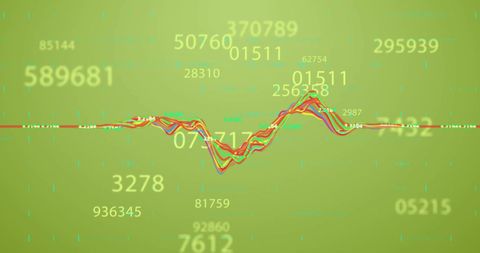
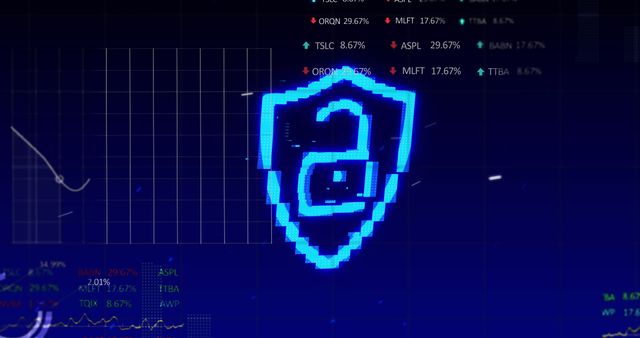
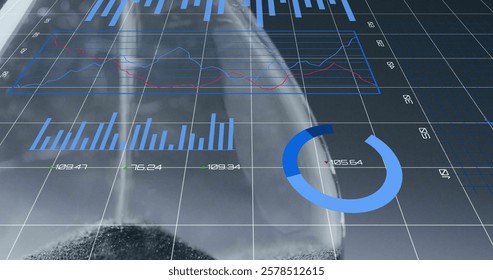
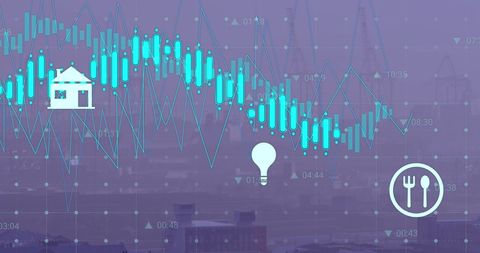
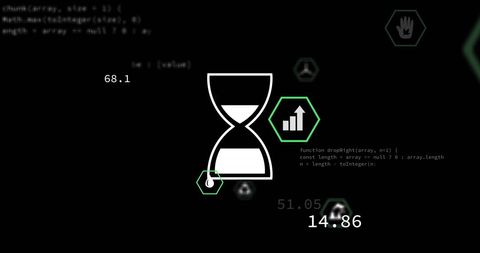
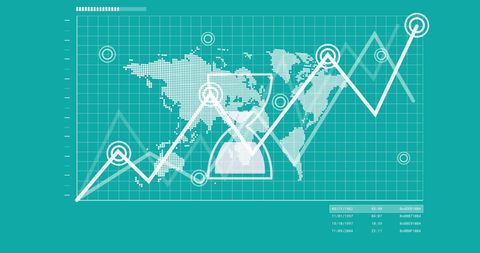
- Digital Data Processing with Hourglass Overlay and Graph
Digital Data Processing with Hourglass Overlay and Graph Image
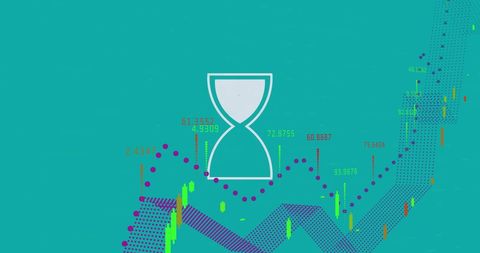
A stylized hourglass sits on top of various digital graph indicators, symbolizing data processing and time. Useful in presentations or articles focused on stock market analysis, data tracking systems, and finance technology. This illustration conveys the interplay of data analysis and time, making it ideal for tech finance content.
Powered by  - Get 15% off with code: PIKWIZARD15


downloads
Tags:
More
Credit Photo
If you would like to credit the Photo, here are some ways you can do so
Text Link
photo Link
<span class="text-link">
<span>
<a target="_blank" href=https://pikwizard.com/photo/digital-data-processing-with-hourglass-overlay-and-graph/10dc42b36eae2da180e14882eabbe38e/>PikWizard</a>
</span>
</span>
<span class="image-link">
<span
style="margin: 0 0 20px 0; display: inline-block; vertical-align: middle; width: 100%;"
>
<a
target="_blank"
href="https://pikwizard.com/photo/digital-data-processing-with-hourglass-overlay-and-graph/10dc42b36eae2da180e14882eabbe38e/"
style="text-decoration: none; font-size: 10px; margin: 0;"
>
<img src="https://pikwizard.com/pw/medium/10dc42b36eae2da180e14882eabbe38e.jpg" style="margin: 0; width: 100%;" alt="" />
<p style="font-size: 12px; margin: 0;">PikWizard</p>
</a>
</span>
</span>
Free (free of charge)
Free for personal and commercial use.
Author: Authentic Images
Similar Free Stock Images

Premium

Premium

Premium


Premium


Premium


Premium


Premium


Premium


Premium


Premium


Premium


Premium


Premium

Premium


Premium


Premium


Premium


Premium


Premium


Premium


Premium


Premium

Premium


Premium

Premium


Explore More Free Stock Images