
- Home >
- Stock Photos >
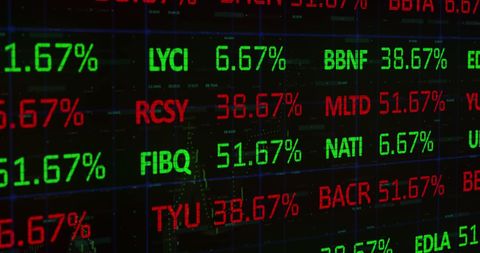
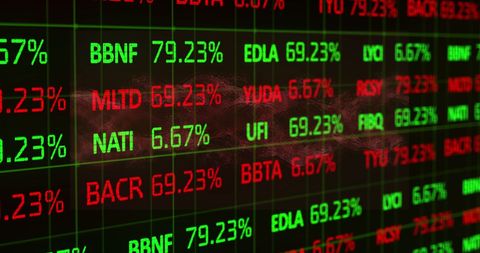
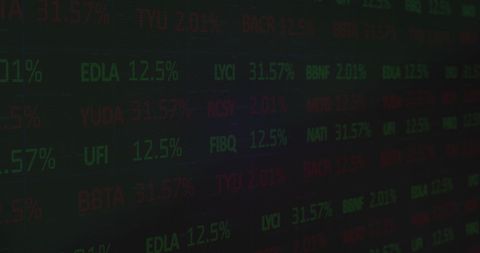
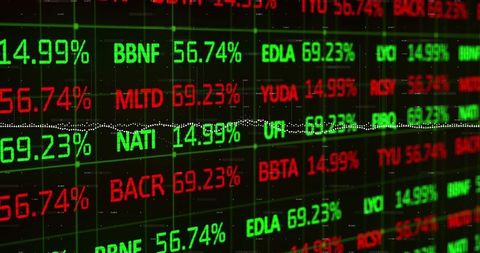
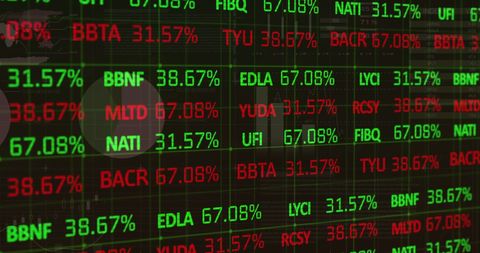
- Digital Data Processing with Rising Red Graph Effects
Digital Data Processing with Rising Red Graph Effects Image

Image shows a vibrant digital financial interface with prominent text and red graph effects rising across the display. This dynamic scene reflects global business activities and financial data fluctuations. Suitable for illustrating stock market topics, financial reports, global economics discussions, and educational materials focused on business finance and technology interpretation.
Powered by 


downloads
Tags:
More
Credit Photo
If you would like to credit the Photo, here are some ways you can do so
Text Link
photo Link
<span class="text-link">
<span>
<a target="_blank" href=https://pikwizard.com/photo/digital-data-processing-with-rising-red-graph-effects/17310790d6517c94b7aeb81a077c589d/>PikWizard</a>
</span>
</span>
<span class="image-link">
<span
style="margin: 0 0 20px 0; display: inline-block; vertical-align: middle; width: 100%;"
>
<a
target="_blank"
href="https://pikwizard.com/photo/digital-data-processing-with-rising-red-graph-effects/17310790d6517c94b7aeb81a077c589d/"
style="text-decoration: none; font-size: 10px; margin: 0;"
>
<img src="https://pikwizard.com/pw/medium/17310790d6517c94b7aeb81a077c589d.jpg" style="margin: 0; width: 100%;" alt="" />
<p style="font-size: 12px; margin: 0;">PikWizard</p>
</a>
</span>
</span>
Free (free of charge)
Free for personal and commercial use.
Author: Creative Art
Similar Free Stock Images

Premium


Premium


Premium


Premium


Premium


Premium


Premium


Premium

Premium


Premium


Premium


Premium

Premium

Premium


Premium

Premium


Premium


Premium


Premium

Premium


Premium


Premium


Premium


Premium


Premium


Explore More Free Stock Images