1. Home > 
  2. Stock Photos > 
  3. Digital Data Processing With Scanning Elements

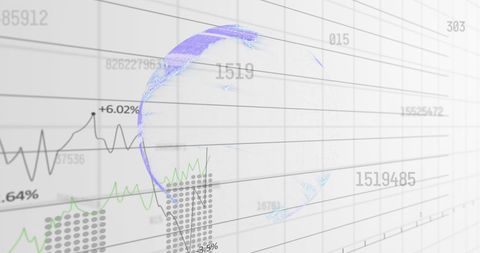
Digital Data Processing With Scanning Elements Image

Digital Data Processing With Scanning Elements

Visual representation of data processing and analysis, ideal for illustrating concepts in economics, technology development, and business intelligence. Perfect for presentations on data management or financial market trends.

Powered by Adobe logo
A holographic bar chart of financial data emerging from a futuristic black device on a dark background - Powered by AdobeFuture financial network where digital currencies intersect with light-speed communication - Powered by AdobeSecure Online Payment Processing Solutions for Businesses Growth and Financial Transactions Management - Powered by AdobeBig data and AI technology, Business intelligence and AI data science, Automating data processing, Machine learning and business intelligence, AI driven data processing, KPI performance monitoring. - Powered by AdobeThis image illustrates a digital financial growth chart over a keyboard, symbolizing business trends, market analysis, and technological advancements in the finance sector. Copula - Powered by Adobe

Credit Photo

If you would like to credit the Photo, here are some ways you can do so

Free (free of charge)

Free for personal and commercial use.

Author: People Creations

Similar Free Stock Images

Digital Financial Analytics with Abstract Data Visualization
Premium
Smartphone displaying a contactless payment icon, representing modern digital financial transactions.
Digital Green Graph Lines on Grid Showing Business Analytics
Premium
Online document validation and quality assessment management, businessman reviewing checklist for business document evaluation, consulting, and market data report analysis.
Premium
Businessman analyzing using tab data on business administration. Strategic planning, financial control, HR management, organizational leadership, and operational efficiency.
Futuristic Green Line Graph Over Global Data Charts
Premium
Abstract tech illustration of digital data flow and processing with lines and dots. Concept of AI blockchain network system and financial transactions shown.
Abstract Digital Art of Purple Shapes on Textured Blue Background
Rising Green Line on Financial Digital Display
Digital Data Processor on Abstract Grid Background
Abstract Financial Graphs and Data Processing Interface
Premium
Business Decisions through advanced data visualization and interactive analytics, AI generative
Green Financial Chart with Upward Trend Line Spikes Dramatically
Neon Stadium with Data Graphics on Dark Background
Digital Circular Interface with Graphs on Green Grid
Data Visualization Social Media Interaction Concept
Premium
A minimalist mockup of digital financial instruments with abstract data lines from a memory card
Dynamic Data Trends on Digital Display for Financial Analysis
Premium
A person's hand interacts with a digital interface for tax refund processing
Financial Data and Growth Arrows Boosting Business Success
Green Financial Graph with Futuristic Clock Interface
Futuristic Fingerprint Scan in Digital Interface Visualization
Dynamic Financial Data Analysis on Graph
Premium
Man typing on laptop with digital receiving invoice and document management icons. Business accounting, data processing, and automation technology for financial operations productivity
Data Visualization Digital Chart Display on White Background
Digital Network Speedometer Displaying Data Transmission
Declining Financial Market Trends with Red Graph Lines
Futuristic Digital Interface with Glowing Multi-Colored Scope
Digital Financial Data and Virtual Analysis Interface
Digital Matrix with Dynamic Data Stream on Grid Background
Dynamic Data Visualization with Green Graph Lines on White Background
Dynamic Stock Market Trends and Data Visualization
Digital Interface with Graphs and Notification Alerts
Futuristic Global Financial Data Analysis Interface with Scanning Scope
Graph Visualizing Economic Downtrend and Financial Data
Financial Data with Downward Trending Red Line Graph on Grid
Green Line Graph Rising on Gradient Background Shows Financial Growth
Digital Data Processing Interface with Graph Analysis
Premium
businessman working with a laptop and a digital screen showing ai and data technology concepts. using  artificial intelligence, which is having a significant impact on the business industry. office ro
Digital Speedometer Displaying 3G, 4G, and 5G Technology with Graph Overlay
Dynamic Green Line Graph on Digital Dashboard
Crypto Market Growth and Analysis Graph
Bitcoin Value Decline with Red Graph on Grayscale Grid
Dynamic Green Line Graph on Data Grid Background
Digital Financial Graphs Overlapping Modern Office Scene
Futuristic Globe with Rising Business Graphs and Data Metrics
Neon Circles on Data Processing Background
Dynamic Zigzag Line Chart Analytics Display with Gradient Bars
Premium
Businesswoman working on laptop with analytics graphs displayed on screen inside warehouse. Concept of logistics, supply chain, inventory management, shipping, ecommerce and distribution.
Digital Interface Background with Circular Data Processing Animation
Abstract Financial Data Processing Background with a Blue Sphere
Dynamic Charts and Lines Displaying Financial Data Trends
Premium
datum, data, technology, ai, management, document, business, flow, analysis, information, artificial, artificial intelligence, datum, neural network,
Futuristic Digital Numbers and Data Interface Overlay
Digital Dashboard with Green Trend Line and Data Visualization Indicators
Digital Data Scanning with Global Financial Analytics Interface
Premium
A businessman interacts with a smartphone, showcasing financial growth indicators and global data analysis, representing the digital transformation in the finance industry. Copula
Neon Clock with Data Visualization on Blue Background
Digital Data Analysis with Network Connections on a Grid Background
Digital Speedometer with Network Evolution Needles on Technological Grid
Digital Financial Data Processing on Grey Grid Background
Financial Data Graphics Overlaying Abstract Flames Background
Stylized Dashboard Displaying Colored Data Analytics Line Graphs
Digital Illustration of Bitcoin Cryptocurrency with Charts and Bubbles
Dynamic Chart and Globe Depict Global Financial Movement
Premium
Man tapping credit card for contactless payment at modern terminal, transaction approved
Declining Financial Chart with Red Lines on Data Grid
Green Line Graph on Grid Interface Displaying Financial Data Trends
Digital Financial Growth with Green Line Graph and Statistics
Digital Financial Data Grid with Numerical Analysis Elements
Red Financial Data Graphic on Grid with Arrow Trendline
Premium
Expert woman asian people discuss review data number costing managerial account prepare monthly actual cost variance report income tax at audit office. ESG budget control ERP process service project.
Premium
Businessman presenting digital invoice with AI cloud and gear icons representing automated financial processing
Futuristic Interface with Scanning Scope and Circuitry Design
Green Line Graph Over Digital Grid Highlighting Data Trends
Financial Market Decline Illustrated on Grid Chart
Digital Interface Featuring Dynamic Chart and Data Indicator
Premium
AI, data analysis. Business people use AI to analyze financial related data. big data Complex performance measurement With modern innovative technology
Digital Data Visualization Chart with Trend Lines
Global Data Analysis and Financial Trends Visualization
Financial Downtrend and Data Analysis Concept
Declining Graph Illustrating Business Loss and Reduction Concept
Premium
Professional businessman interacts with digital interface for claims processing and financial protection
Futuristic Financial Data Dashboard with 3D Global Interface
Futuristic Digital Interface with Grid and Markers
Digital Scope Scanning Financial Data with Technological Interface
Dynamic Graph Lines Over Digital Grid Background
Digital Dashboard Showing Financial Analysis with Graphs
Premium
Digital Invoice Processing Technology Secure Payment Management System for Business Financial Transactions and Automated Billing Solutions
Displaying Blue Trend Lines on Grid Analytics Dashboard with Markers and Data Values
Neon Clock Overlapping Business Data Visualization
Dynamic Growth Over Time on Grid Background
Premium
Data center with a blurred image of the data. Video of financial information server with realistic visualization. International commerce and financial management lifestyle room with interfaces.
Premium
Abstract illustration showcasing financial data analysis with flowing lines charts and graphs in a blue gradient background
Futuristic Digital Data Dashboard with Rising Line Graph
Futuristic Computer Interface with Data Visualization Overlay
Futuristic Data Analysis Interface with Green Trend Lines
Abstract Data Processing Flow on Digital Interface
Rising Green Graph Lines over Business Data
Green Line Processing Over Clock with Business Analytics
Futuristic Digital Graph with Ascending Trend Line in Blue and Green
Geometric Bull Symbol with Digital Grid in Green
Neon Circular Patterns with Dynamic Data Interface
Abstract Digital Graph with Data Visuals and Scope Interface
5G Technology Concept with Financial Data Visualization
Futuristic Digital Financial Graphs with Energy Icon
Premium
From above of crop anonymous female dealer touching screen of cellphone with graphs while sitting on meadow
Premium
Businessman showing online document validation icon, quality assessment management With a checklist, business document evaluation process, market data report analysis and consulting,
Financial Growth Concept with Green Upward Line Graph
Futuristic Digital Data Analysis Close-Up
Futuristic Digitized Network with Abstract Geometric Patterns
Digital Financial Grid with Statistical Analysis Lines
Futuristic Digital Calendar with Neon Pink Glow
Futuristic Data Interfaces in Science and Technology
Dynamic Data Visualization with Virtual Graphs and Numbers
Rising Financial Statistics on Digital Grid Background
Premium
A digital representation showing the intersection of technology and finance, this image showcases an AI-enhanced stock chart, AI-Driven Stock Chart
Rising Green Graph on Financial Data Grid Background
Declining Financial Graph on Grid Background
Financial Data and Graphs with Futuristic Interface
Creative Finance Chart with Green Growth Line and Digital Interface
Premium
Man wearing augmented reality glasses analyzes futuristic digital data market trends and financial charts
Premium
Businessman pointing on NLP natural language processing for command and support ai automation working and big data analysis communication in auto chatbot and machine learning
Futuristic Cryptocurrency Market Chart with Green Line Progression
Futuristic Interface with Light Trails and Hexagonal Designs
Explore More Free Stock Images