
- Home >
- Stock Photos >
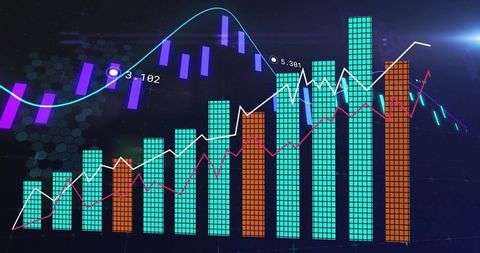
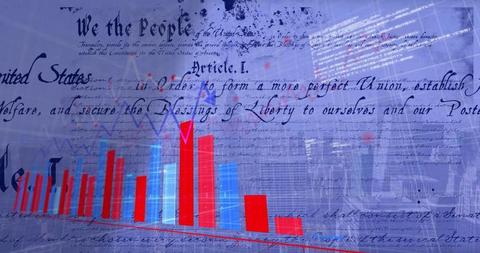
- Digital Data Processing with Statistical Charts
Digital Data Processing with Statistical Charts Image

Illustration showcasing a digital representation of data with overlapping bar charts and line graphs. Bright colors highlight financial and business analytics concepts. Ideal for use in presentations about data analysis, financial forecasting, or modern statistical methods. Suitable for technology, finance sector, and educational purposes emphasizing global connectivity and advanced computing.
Powered by  - Get 15% off with code: PIKWIZARD15


downloads
Tags:
More
Credit Photo
If you would like to credit the Photo, here are some ways you can do so
Text Link
photo Link
<span class="text-link">
<span>
<a target="_blank" href=https://pikwizard.com/photo/digital-data-processing-with-statistical-charts/d6119a032f74f1e7177a7f9b1867f99c/>PikWizard</a>
</span>
</span>
<span class="image-link">
<span
style="margin: 0 0 20px 0; display: inline-block; vertical-align: middle; width: 100%;"
>
<a
target="_blank"
href="https://pikwizard.com/photo/digital-data-processing-with-statistical-charts/d6119a032f74f1e7177a7f9b1867f99c/"
style="text-decoration: none; font-size: 10px; margin: 0;"
>
<img src="https://pikwizard.com/pw/medium/d6119a032f74f1e7177a7f9b1867f99c.jpg" style="margin: 0; width: 100%;" alt="" />
<p style="font-size: 12px; margin: 0;">PikWizard</p>
</a>
</span>
</span>
Free (free of charge)
Free for personal and commercial use.
Author: People Creations
Similar Free Stock Images

Premium


Premium

Premium


Premium


Premium


Premium


Premium


Premium


Premium

Premium

Premium


Premium


Premium


Premium


Premium


Premium


Premium


Premium


Premium

Premium


Premium

Premium


Premium


Premium


Premium


Explore More Free Stock Images