1. Home > 
  2. Stock Photos > 
  3. Digital Data Stream with Code Overlay on Technical Graph

Digital Data Stream with Code Overlay on Technical Graph Image

Digital Data Stream with Code Overlay on Technical Graph

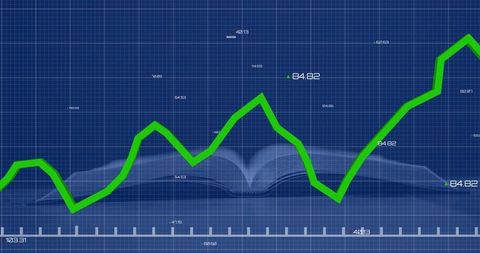
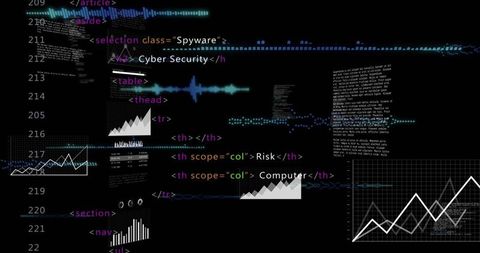
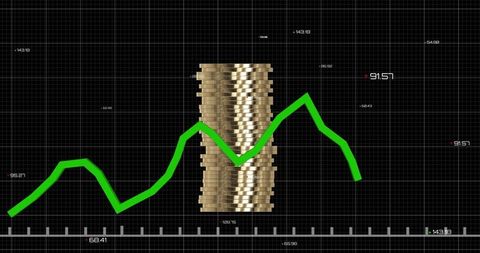
Dynamic and visually engaging backdrop, showcasing green data lines amid cascading digital code on a grid. Ideal as visual content for technology blogs, data science projects, coding bootcamp promotions, or IT training materials. Use as eye-catching imagery illustrating vast data processing, global connections, or cutting-edge computing advances.

Powered by Shutterstock logo - Get 15% off with code: PIKWIZARD15
Data Processing, digital technology, internet network concept. Computer programmer working on big data and computer code with data center, server room as backgrounds - Powered by Shutterstock - Get 15% off with code: PIKWIZARD15Neural Network Big Data Flow Visualization, Binary Code Matrix, AI Machine Learning Abstract Background, Quantum Computing, Cyber Security, Futuristic Technology Artificial Intelligence Digital Grid - Powered by Shutterstock - Get 15% off with code: PIKWIZARD15Digital technology, software development concept. Coding programmer, software engineer working on laptop with circuit board and javascript on virtual screen, internet of things IoT - Powered by Shutterstock - Get 15% off with code: PIKWIZARD15Business developer using Kanban board framework on laptop computer. Agile software development lean project management tool, project management, business development concept - Powered by Shutterstock - Get 15% off with code: PIKWIZARD15Coding software developer work with AR new design dashboard computer icons of scrum agile development and code fork and versioning with responsive cybersecurity.Co working process, team working. - Powered by Shutterstock - Get 15% off with code: PIKWIZARD15

Credit Photo

If you would like to credit the Photo, here are some ways you can do so

Free (free of charge)

Free for personal and commercial use.

Author: Creative Art

Similar Free Stock Images

Dynamic Financial Data Graph in Digital Grid Display
Premium
Data science. Innovation technology, digital software development concept. Algorithm and deep learning of AI artificial intelligence, data engineering and global network. data processing technology.
Financial Market Decline on Digital Screen With Red Line Graph
Data Analysis Process with Green Digital Interface
Financial Data Chart Over City Silhouette
Financial Graph Over Cityscape Depicting Data Trends and Analytics
Premium
IT engineer coding on a modern computer with the help of artificial intelligence (AI). Big Data software development. Software apps developer and IT revolution.Digital software development.
Digital Financial Data Analytics and Economic Trends
Cryptocurrency Growth Chart Over Digital World Map
Declining Financial Market Chart Over Grid Background
Green Line Chart with Financial Data on Digital Display
Premium
Man interacting with a holographic touchscreen interface in red color. Concept of cyber attack, malware, data breach, system hacking, virus, spyware, compromised information and urgent attention.
Financial Market Chart on Digital Screen Showing Growing Trends
Green Data Graph on Black Digital Interface
Dynamic Financial Data Representation on Digital Grid
Digital Financial Data Interfaces in Global Connection
Premium
Data science, digital technology concept. Computer science engineer programming on laptop at office, data exchange, system control and data management with Ai, Business and Artificial intelligence
Sharp Decline in Stock Market Graph Against Red Financial Data Background
Dynamic Red Line Graph With Data Points on Gridded Background
Green Financial Data Chart with Technological Overlay
Colorful Financial Graphs on Digital Grid Background
Premium
Digital technology, cloud computing concept. Software engineer using mobile smart phone and laptop computer with global network connection, Technology, innovative and communication concept.
Fluctuating Financial Graph on Green Grid Background
Financial Data Analysis with Declining Trend on Blueprint Graph
Dynamic Financial Stock Market Analysis Display
Green Line Graph Overlaid on Empty Office with Data Overlay
Premium
Digital transformation concept.
Colorful Financial Data Charts on Digital Grid Background
Red Zigzag Graph on Digital Analytics Dashboard Interface
Dynamic Data Visualization Displaying Interactive Waveforms
Blueprint Analysis with Green Line Graph on Open Book
Red Declining Graph on Digital Grid Display Represents Falling Markets
Dynamic Stock Market Graphs with Trends and Data Alerts
Premium
Man Typing Keyboard Laptop Hand.Project Manager Researching Process.Business Team Working Startup modern Office.Global Strategy Virtual Icon.Innovation Graphs Interfaces.Analyze market stock.Blurred
Digital Currency Trading Interface with Data Visualization
Financial Graph and Cityscape Analysis with Technological Overlay
Red Line Graph Over Histogram Representing Financial Volatility
Economic Trends Depicting Ukraine Crisis Concept
Premium
Data Processing, digital technology, internet network technology concept. Man computer programmer working on big data and computer code with data center, server room as backgrounds
Dynamic Green Line Graph Showing Financial Data Fluctuations
Green Financial Line Graph with Candlestick Data on Grid Background
Declining Graph Overlay on Night Traffic Scene Illustrates Downtrend
Global Data Exchange Network
Premium
Young adult Asian male, female software developer coding program on desktop computer. Man, woman work from home, remote working, freelance programmer job, smart digital nomad lifestyle concept
Digital Data Processing Interface with Green Growth Chart
Financial Growth Chart with Dynamic Green Line on Grid Overlay
Declining Stock Market Graph with Red Trend Line
Dynamic Red Line Graph on Digital Data Grid Background
Premium
DevOps software development and IT operations programer development concept with dev and ops icon computer screen project manager operation sysadmin.working in agile methodology environment
Futuristic Data Trend Graphs on Digital Interface
Financial Data Analysis with Digital Graph Overlay
Digital Financial Data Processing with Trend Lines
Digital Interface with Overlapping Code and Graph
Premium
Portrait of Woman Creating a Software and Coding, Surrounded by Big Screens Displaying Lines of Programming Language Code. Female Programmer Working in a Monitoring Room. Futuristic Concept
Fluctuating Financial Graph on Digital Orange Background
Digital Decline Graphic with QR Code Elements and Red Line
Dynamic Diagrams of Data Processing on Digital Interface
Financial Graph Showing Indices Trends on Blue Background
Premium
Computer programmer working on big data and computer code in a data center or server room. Data processing, digital technology, and the concept of an internet network.
Dynamic Financial Trading Chart with Candlestick Graphs
Dynamic Financial Graph with Candlestick Patterns and Percentage Metrics
Red Line Chart Trending Downward in Data Visualization
Dynamic Financial Graphs with Statistical Data on Blue Grid
Rising Stock Market Trends and Chart Analysis
Digital Data Processing Interface with Code and Graph
Premium
Man look at the dashboard with graphs and charts. Concept of data management system, business intelligence, data statistics, marketing analysis, key performance indicators (KPI) and analytics.
Dynamic Financial Data Visualization over Urban Silhouette
Fluctuating Financial Graph With Data Visualization
Dynamic Financial Data Analysis with Virtual Screen
Futuristic Graph and Data Visualization Interface Design
Premium
Software Engineer and Software development concepts,  programming for various devices, computer programmer, coding process, chart, testing platform Data analytics, online safety.
Rising Green Line Chart Overlays Concept of Financial Growth
Digital DNA and Data Analytics Fusion Visualization
Digital Lock with Real-Time Data Display
Digitized Financial Data Analysis with Graphs and Codes
Premium
Man look at the dashboard with graphs and charts. Concept of data management system, business intelligence, data statistics, marketing analysis, key performance indicators (KPI) and analytics.
Futuristic Data Processing Interface with Dynamic Graphs
Digital Data Analytics with Financial Graphs and Indigo Background
Dynamic Financial Chart with Red Line Graph on Digital Interface
Financial Data Analysis with Interactive Graphs
Premium
DevOps engineer in Digital transformation technology strategy of business processes and data, optimize and automate operations, customer service management, Businessman using pen work with data chart
Dynamic Financial Data on Dark Background With Colorful Graphs
Digital Stock Market Data and Trends Visualization
Digital Financial Data Analysis on Dark Background
Financial Data Visualization with Global Network Elements
Premium
Back View of a Young Engineer Working on Computer in a Technological Office Environment. Male Programmer Writing Software Code for a Blockchain Project, Developing Backend System
Financial Data Visualization with Declining Trend Line
Digital Data Analysis on Futuristic Black Background
Dynamic Digital Stock Market Chart with Growing Financial Trends
Analytics Dashboard with Dynamic Financial Graphs and Data
Premium
Developing programming and coding technologies. Website design. Cyber space concept.
Dynamic Data Visualization with Fluctuating Trendline and Indicators
Market volatility dashboard with candlestick trends, percentage labels and gold star overlay
Dynamic Graphs Depicting Financial Trends on Purple Grid Background
Dynamic Financial Graph with Changeable Metrics Over Green Line
Digital Interface with Data Processing Visualization
Cityscape Enhances Financial Data Visualization Digital Concept
Premium
Data Processing, digital technology, internet network concept. Computer programmer working on big data and computer code with data center, server room as backgrounds
Declining Graph with 49% Reduction on Dark Digital Background
Economic Trends Analysis with Financial Indicators and Graphs
Financial Growth Trends Over Cityscape Background
Businesswoman Discussing Market Trends with Digital Chart Overlay
Premium
Business developer using Kanban board framework on laptop computer. Agile software development lean project management tool for fast changes, project management concept
Digital Financial Data and Global Market Analysis on Graph
Data Analysis and Cybersecurity Concept Art
Digital Interface Displaying Volatile Financial Market Analysis
Dynamic Data Chart on Dark Digital Background
Premium
Data management, Business developer using Kanban board framework on laptop computer. Agile software development, document, database management concept. Business and technology background
Dynamic Forex Market Chart with Multiple Currencies and Growth Trends
Dynamic Stock Market Analysis Concept Artwork
Digital Stock Market Graph with Abstract Coding Background
Stock Market Analysis and Data Processing Graphic
Premium
Python Programming Web Development Coding Concept.Software development concepts and programming for various devices, Software Engineer Computer programming, coding process, chart, and Data analytics.
Abstract Data Visualization with Neon Waveforms
Global Financial Data and Stock Market Trends on World Map
Digital Data Waveform on High-Tech Interface
Analyzing Growing Graph Line on Purple Gradient Background
Premium
Data science and engineering, digital technology, futuristic tech background. Software engineer working with database and big data analytics, cloud computing with AI and data exchange
Financial Chart with Dynamic Data on Black Grid
Neon Candlestick Chart with Codes and Data Visualization Concept
Fluctuating Financial Data with Graph Overlay
Fluctuating Red Line on Digital Analytics Dashboard
Premium
Computer programmer coding on modern computer with AI Artificial Intelligence. Data science, software development, cloud computing, digital technology, big data management, data exchange concept
Dark Neon Cybersecurity Dashboard with Code, Analytics Charts, Waveforms, Risk Metrics