- Home >
- Stock Photos >
- Digital Data Timeline Visualization Highlighting Year Comparison
Digital Data Timeline Visualization Highlighting Year Comparison Image
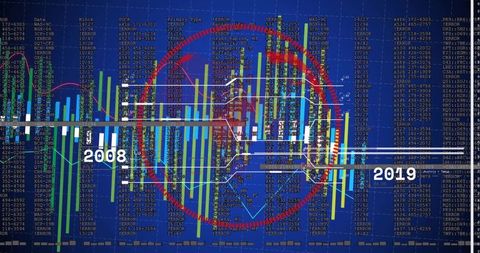
Timeline graph displaying data progression from 2008 to 2019 with red highlight emphasizes certain points. Useful for presenting a historical analysis in financial reports, showcasing trends over time in conferences or educational settings. Can be used in presentations about business growth or economic research design insights related to data evolution.

downloads
Tags:
More
Credit Photo
If you would like to credit the Photo, here are some ways you can do so
Text Link
photo Link
<span class="text-link">
<span>
<a target="_blank" href=https://pikwizard.com/photo/digital-data-timeline-visualization-highlighting-year-comparison/d31cd1bf5c45057b53c1bc685e0806b9/>PikWizard</a>
</span>
</span>
<span class="image-link">
<span
style="margin: 0 0 20px 0; display: inline-block; vertical-align: middle; width: 100%;"
>
<a
target="_blank"
href="https://pikwizard.com/photo/digital-data-timeline-visualization-highlighting-year-comparison/d31cd1bf5c45057b53c1bc685e0806b9/"
style="text-decoration: none; font-size: 10px; margin: 0;"
>
<img src="https://pikwizard.com/pw/medium/d31cd1bf5c45057b53c1bc685e0806b9.jpg" style="margin: 0; width: 100%;" alt="" />
<p style="font-size: 12px; margin: 0;">PikWizard</p>
</a>
</span>
</span>
Free (free of charge)
Free for personal and commercial use.
Author: People Creations