
- Home >
- Stock Photos >
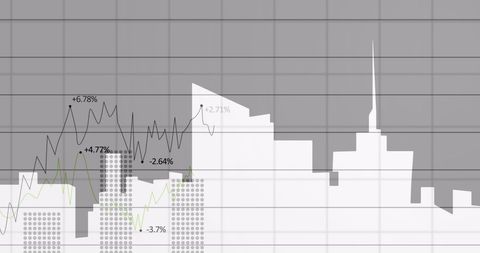
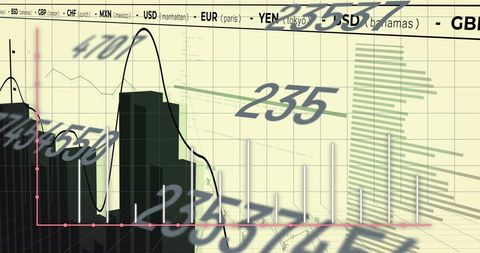
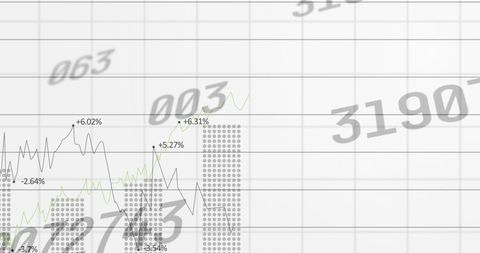
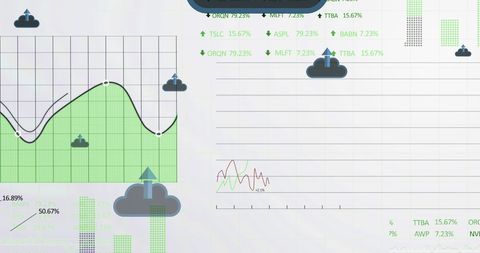
- Digital Data Transformation and Dynamic Graph Analysis
Digital Data Transformation and Dynamic Graph Analysis Image
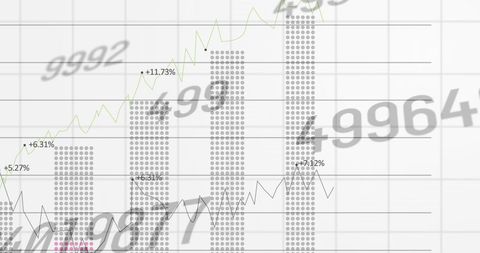
This image features an abstract concept of data transformation and dynamic graph analysis, with numbers transitioning over a grid. It is ideal for presentations or articles focused on data analytics, financial growth, or digital technology advancements. The visual aspects highlight concepts of progression and changing statistics, making it suitable for business reports and academic purposes.
Powered by 


downloads
Tags:
More
Credit Photo
If you would like to credit the Photo, here are some ways you can do so
Text Link
photo Link
<span class="text-link">
<span>
<a target="_blank" href=https://pikwizard.com/photo/digital-data-transformation-and-dynamic-graph-analysis/f25048e4a4cad8fcc62d999873dd20f7/>PikWizard</a>
</span>
</span>
<span class="image-link">
<span
style="margin: 0 0 20px 0; display: inline-block; vertical-align: middle; width: 100%;"
>
<a
target="_blank"
href="https://pikwizard.com/photo/digital-data-transformation-and-dynamic-graph-analysis/f25048e4a4cad8fcc62d999873dd20f7/"
style="text-decoration: none; font-size: 10px; margin: 0;"
>
<img src="https://pikwizard.com/pw/medium/f25048e4a4cad8fcc62d999873dd20f7.jpg" style="margin: 0; width: 100%;" alt="" />
<p style="font-size: 12px; margin: 0;">PikWizard</p>
</a>
</span>
</span>
Free (free of charge)
Free for personal and commercial use.
Author: Authentic Images
Similar Free Stock Images

Premium


Premium


Premium


Premium


Premium

Premium


Premium


Premium

Premium


Premium


Premium


Premium


Premium


Premium


Premium

Premium


Premium


Premium


Premium


Premium


Premium


Premium


Premium


Premium


Premium


Explore More Free Stock Images