
- Home >
- Stock Photos >
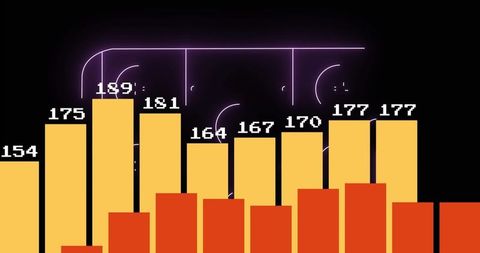
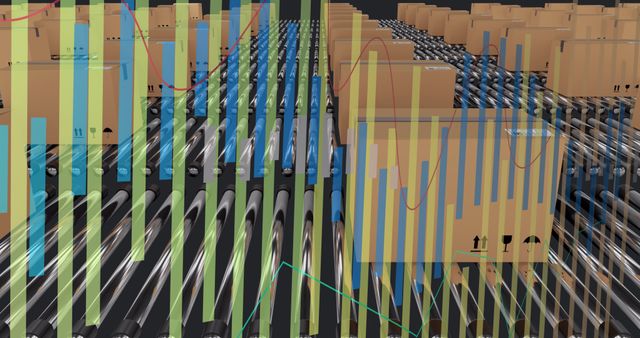
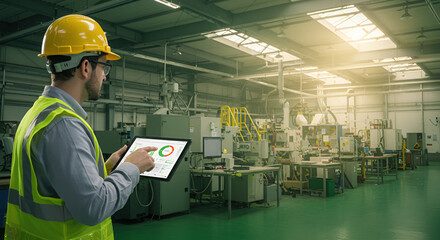
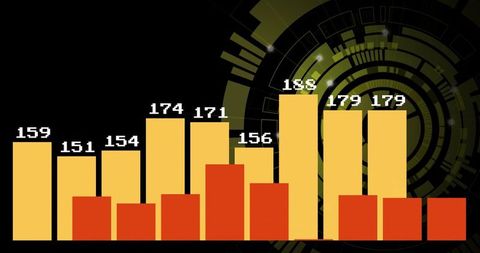
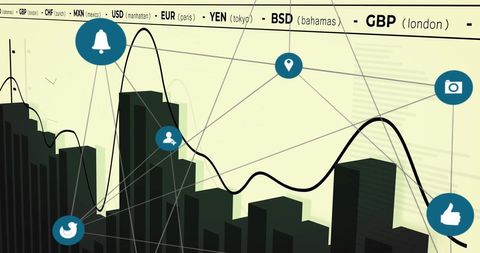
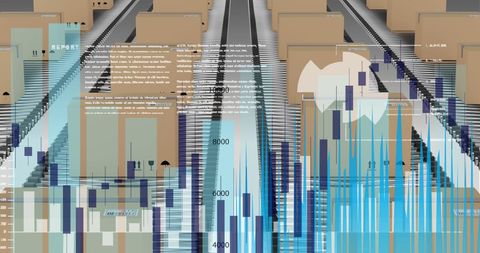
- Digital Data Visual with Futuristic Tech Abstract
Digital Data Visual with Futuristic Tech Abstract Image

This visual demonstrates data processing within a futuristic tech concept, perfect for articles or presentations on modern analytics, data science, or technological advancements. Vibrant charts against abstract geometric backgrounds highlight digital innovation and computing themes, ideal for digital marketing materials or tech-related content.
Powered by 


downloads
Tags:
More
Credit Photo
If you would like to credit the Photo, here are some ways you can do so
Text Link
photo Link
<span class="text-link">
<span>
<a target="_blank" href=https://pikwizard.com/photo/digital-data-visual-with-futuristic-tech-abstract/68ffeedbe39b8815518dfa5a47977e09/>PikWizard</a>
</span>
</span>
<span class="image-link">
<span
style="margin: 0 0 20px 0; display: inline-block; vertical-align: middle; width: 100%;"
>
<a
target="_blank"
href="https://pikwizard.com/photo/digital-data-visual-with-futuristic-tech-abstract/68ffeedbe39b8815518dfa5a47977e09/"
style="text-decoration: none; font-size: 10px; margin: 0;"
>
<img src="https://pikwizard.com/pw/medium/68ffeedbe39b8815518dfa5a47977e09.jpg" style="margin: 0; width: 100%;" alt="" />
<p style="font-size: 12px; margin: 0;">PikWizard</p>
</a>
</span>
</span>
Free (free of charge)
Free for personal and commercial use.
Author: Awesome Content
Similar Free Stock Images

Premium


Premium


Premium


Premium


Premium


Premium


Premium


Premium


Premium

Premium


Premium


Premium


Premium


Premium


Premium


Premium


Premium


Premium


Premium

Premium


Premium


Premium

Premium


Premium


Premium

Explore More Free Stock Images