- Home >
- Stock Photos >
- Digital Data Visualization and Processing Interface
Digital Data Visualization and Processing Interface Image
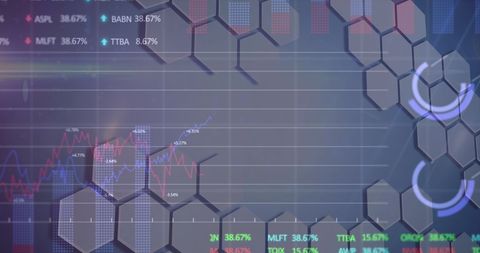
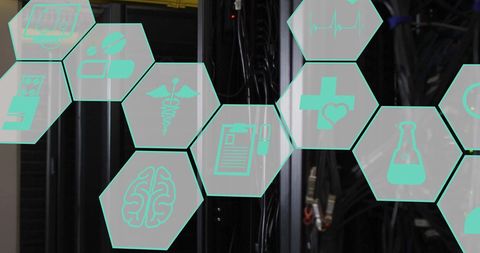
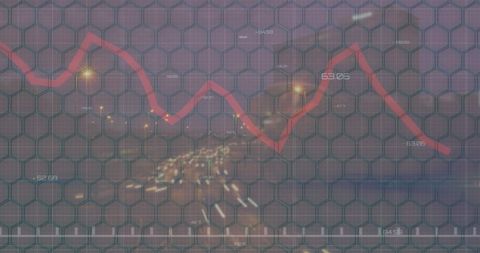
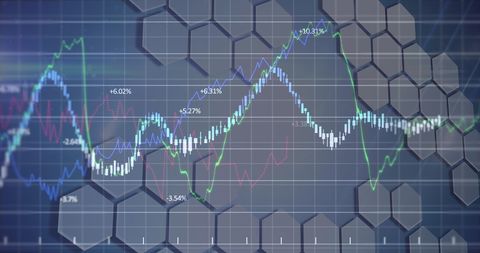
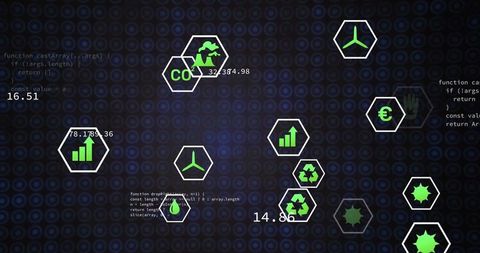
Visual depicting complex graphs and percentages on a futuristic interface. Hexagonal patterns integrate with charts indicating data comparison and insights. Ideal for financial analytics, technology-focused presentations, or illustrating global communication networks.

downloads
Tags:
More
Credit Photo
If you would like to credit the Photo, here are some ways you can do so
Text Link
photo Link
<span class="text-link">
<span>
<a target="_blank" href=https://pikwizard.com/photo/digital-data-visualization-and-processing-interface/de070c02a082ba42adaadaa4375dac22/>PikWizard</a>
</span>
</span>
<span class="image-link">
<span
style="margin: 0 0 20px 0; display: inline-block; vertical-align: middle; width: 100%;"
>
<a
target="_blank"
href="https://pikwizard.com/photo/digital-data-visualization-and-processing-interface/de070c02a082ba42adaadaa4375dac22/"
style="text-decoration: none; font-size: 10px; margin: 0;"
>
<img src="https://pikwizard.com/pw/medium/de070c02a082ba42adaadaa4375dac22.jpg" style="margin: 0; width: 100%;" alt="" />
<p style="font-size: 12px; margin: 0;">PikWizard</p>
</a>
</span>
</span>
Free (free of charge)
Free for personal and commercial use.
Author: Authentic Images