1. Home > 
  2. Stock Photos > 
  3. Digital Data Visualization Charts and Graphs on Purple Background

Digital Data Visualization Charts and Graphs on Purple Background Image

Digital Data Visualization Charts and Graphs on Purple Background

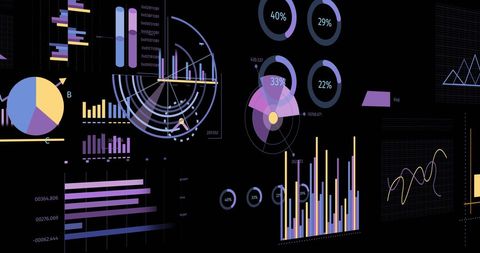
Colorful charts and graphs are floating against a purple background, symbolizing modern technology-driven data analysis and representation. The presentation includes various types of charts such as line graphs, pie charts, and bar graphs. This imagery is ideal for use in presentations related to financial analysis, business intelligence, data analytics startups, or any digital visual content stressing technology’s impact on statistical analysis and computation fields.

Powered by Shutterstock logo - Get 15% off with code: PIKWIZARD15
Businessman using laptop computer analyzing sales data and financial growth graph chart report. Business planning, strategy and development. Financial accounting. market research, data analysis - Powered by Shutterstock - Get 15% off with code: PIKWIZARD15Futuristic Digital Growth Chart – 3D Bar Graph with Glowing Blue Data Visualization - Powered by Shutterstock - Get 15% off with code: PIKWIZARD15Big data analytics with AI technology. Data analyst analyzing and visualizing complex information network with artificial intelligence. Machine learning algorithm for business analytics and finance. - Powered by Shutterstock - Get 15% off with code: PIKWIZARD15Dashboard finance management on laptop computer analyzing sales data and growth graph chart report. Business planning, strategy and development. Financial accounting. market research, data analysis - Powered by Shutterstock - Get 15% off with code: PIKWIZARD15Analyzing Key Performance Indicators. Businessman using digital screen to analyze key performance indicators (KPI) with various graphs and charts, showcasing data analysis and performance tracking. - Powered by Shutterstock - Get 15% off with code: PIKWIZARD15

Credit Photo

If you would like to credit the Photo, here are some ways you can do so

Free (free of charge)

Free for personal and commercial use.

Author: Authentic Images

Similar Free Stock Images

Dynamic Financial Data Visualization with Graphs
Premium
Professional data analyst using data visualizations dashboard on computer monitor for data business analysis and Data Management System
Financial Data Processing with Digital Charts and Icons
Global Financial Data and Analysis Interface
Digital Data Analysis and Processing in Technological Environment
Abstract Digital Data Processing and Analytics Interface
Premium
Big data technology and data science. Data scientist querying, analysing and visualizing complex set on virtual screen. Data flow concept. Neural network, artificial intelligence, ML, analytics.
5G Technology and Data Innovations on a Global Scale
Digital Financial Data and Technology Visualization
Data and Analytics Overlay on Bustling Cityscape
Global Business Data Interface with Light Spots
Premium
Analysts use computers to analyze statistical data to improve targeted digital online marketing strategies for a business advantage. Data Science Software Developer.
Colorful Data Visualizations on Dark Background Abstract Design
Colorful Infographic Elements for Business and Data Analysis
Virtual Statistics Dashboard Displaying Financial Data Visualizations
Digital Data Processing and Financial Chart Analysis
Premium
A close-up view of a hand interacting with a digital tablet displaying various data visualizations, ideal for exploring business analytics and technology.
Abstract Futuristic Financial Technology Graphic with Virtual Data Icons
Abstract Infographic with Data Visualizations on Dark Background
Creative Light Bulb Maze for Data Processing and Analysis
Fuel Gauge and Statistical Data Visualizations
Premium
Hand holding smartphone displays data visualizations, including histogram and pie chart. Analytics, digital transformation and increasing use of mobile technology in business. Minimalist art collage.
Futuristic Network Technology and Data Analysis Visualization
Digital Financial Dashboard with Analytics and Data Visualization
Digital Interface with Data Processing Charts and Binary Codes
Digital Financial Data Analysis with Interface Elements
Premium
Many charts and graphs. Reflection light and flare. Concept image of data gathering and statistical working.
Digital Data Visualization with Virtual Dashboard Indicators
Futuristic Digital Finance Interface with Global Data Visualization
Futuristic Trading and Data Analysis Platform with Trend Visualizations
Futuristic Analytics Dashboard Interface with Charts
Global Financial Data Analysis with Blue World Map Overlay
Social Media Reactions Overlaying Data and Analytics Background
Premium
Big data technology and data science with person touching data flowing on virtual screen. Business analytics, artificial intelligence, machine learning. Engineer or scientist analyzing stream of data.
Digital Data Processing with Vibrant Graphs
Digital Data Processing and Global Networking Visualization
Futuristic Data Interface with Media Icons and Data Processing
Global Connections with Digital Data Arrows on Blue Network
Premium
Strategizing Wealth Management: Close-up of Hands Holding Financial Data amidst Office Desktop Dynamics
Financial Technology and Digital Data Integration
Advanced Data Interface with Stock Market Analytics Graphics
Innovative Financial Data Visualization Over Cityscape
Digital Financial Data Analysis with Infographics on Black Background
Premium
Data science and big data technology. Scientist computing, analysing and visualizing complex data set on computer. Data mining, artificial intelligence, machine learning, business analytics.
Colorful Data Charts and Graphics on White Background
Dynamic Financial Data on Digital Interface Screen
Vibrant Bar Graph and Digital Data Analysis Interface
Data Analytics with Speedometer Driving Business Innovation
Premium
Big data technology and data science. Data scientist querying, analysing and visualizing complex information on virtual screen. Data flow concept. Business analytics, finance, neural network, AI, ML.
Bitcoin Symbol Overlaying Stock Market Data
Global Financial Data and Analytics Visualization Concept
Ransomware Threat Over Data Processing Graphs and Charts
Digital Financial Data Over Earth: Global Business Concept
Premium
Data analysis science and big data with AI technology. An analyst or Scientist uses a computer and dashboard to analyze information on complex data sets on a computer. Insights development engineer.
Colorful Financial Data Visualization on Dark Background
Futuristic 6G Technology with Graphs and Global Connectivity Icons
Financial Data Visualization with Digital World Map and Graphs
Abstract Digital Interface with Global Data Visualizations
Premium
Businessman analyze and visualize complex information on a virtual screen using AI to process data. Big data technology and data science.Data flow.Digital neural network.artificial intelligence
Futuristic Financial Data Analysis with Candlestick Visualization
3D Digital Dashboard with Analytics in Virtual Space
Futuristic navy-blue HUD presenting vertical bar charts, line graphs, gauges, neon green icons
Global Finance Technology With Floating Mathematical Equations
Digital Finance Interface with Flowing Analytical Data Graphics
Abstract Financial Data on Digital Interface Over Office Background
Premium
Scientist working with business data, finance, marketing report, Big Data Analytics technology, Processing Complexity information flow on virtual screen, machine learning, artificial intelligence, ML
Digital Interface with Global Data Analytics Concepts
Global Financial Data Processing and Interface Concept
Global Network of Connections with Data Processing Elements
Financial Data Visualization with Interactive Graphs and Charts
Premium
Big data analysis with AI technology. Person using machine learning and deep learning neural network for data science, data mining, business analytics, automation, data engineering. Glowing particles.
Financial Data Analysis with Graphs and Charts on Abstract Grid
Futuristic Financial Data Dashboard with Graphs
Abstract Financial Data Visualizations on Purple Background
Colorful Data Analytics Representations on Purple Background
Premium
businessman holding data visualization
Futuristic Financial Data Processing with Digital Interface
Dynamic Data Analytics with Global Business Interfaces
Speedometer and Data Charts on Blue Digital Background
Abstract Interface Displaying Colorful Data Visualizations
Premium
Hand using stylus on tablet with futuristic digital analytics interface, glowing data visualizations, charts, and graphs, technology concept
Digital Interface Displaying Data Analytics in Modern Office
Data Analytics Dashboard with Displayed Graphs and Statistics
Digital Financial Data Visualization with Dynamic Graphs
Digital Interface with Mathematical Equations and Pie Charts
Premium
Digital economic growth chart with a rising trend towards 2025, symbolizing future market predictions.
Abstract Global Finance and Data Processing Technology
Futuristic Digital Data Analysis with Graphs and Cloud Icon
Digital Infographic on Statistical Data Analytics
Digital Financial Data Stock Market Analytics Display
Premium
Professional data analyst using data visualizations dashboard on computer monitor for data business analysis and Data Management System
Interactive Data Analysis with Virtual Avatars and Visual Elements
Glowing central data visualization with converging line graphs on holographic dashboard
Financial Data Analysis and Business Technology Concept
Advanced Data Analytics with Digital Interface Overlays
Advanced Financial Data Processing Chart Visualization
Futuristic Dashboard with Fuel Gauge and Data Visualization
Premium
Man look at the dashboard with graphs and charts. Concept of data management system, business intelligence, data statistics, marketing analysis, key performance indicators (KPI) and analytics.
Global Network Connections and Data Processing Virtual Concept
Digital Data Processing on Blue Tech Background
Digital Interface Featuring Financial Data and Charts in 4K
Digital Data Analysis with Rising Trend Charts and Metrics
Premium
Man look at the dashboard with graphs and charts. Concept of data management system, business intelligence, data statistics, marketing analysis, key performance indicators (KPI) and analytics.
Digital Representation of Financial Data Analysis on Purple Background
Abstract Infographics Representing Financial Data Analytics
Futuristic Data Visualization with Graphs
Abstract Digital Graphs Depicting Financial Statistics Analysis
Premium
Businessman pointing chart financial goals and economic business planning global.
Digital Financial Analytics and Data Visualization
Dynamic Stock Market Data Interface with Glowing Graphs
Financial Data Overlay with Business Growth Charts in Modern Cityscape
Colorful Data Visualization Charts and Graphs on Blue Background
Premium
Big data analysis with AI technology for business analytics. Insights from data mining, filtering, sorting, clustering. Data scientist working on machine learning on virtual computer screen.
Futuristic Digital Data Visualizations and Statistics Interface
Futuristic Data Screens Showing Business Analytics and Growth Trends
Digital Interface with Financial and Statistical Data Visualizations
Futuristic Data Analysis Interface with Infographics and Graphs
Premium
Analyst team utilizing BI Fintech to analyze financial report with tablet over paper on table and analyzing BI power dashboard display on tablet screen for business insight. Panorama shot. Scrutinize
Digital Data Processing Over World Map for Global Finance
Futuristic Financial Data and Graphs for Analysis
Dynamic Financial Charts with Global Data Networks Background
Dynamic Dashboard Visuals with Bar Charts and HUD Interface
Premium
Displaying dashboard showing pie, bar, line and candlestick charts with percentage labels on screen. Futuristic, analytics, technology, innovation, data, interface, visualization
Maroon Data Dashboard Showing Declining Red Area Chart With Pie Charts and Candlestick Trends