
- Home >
- Stock Photos >
- Digital Data Visualization Dashboard Showing Financial Chart and Analytics
Digital Data Visualization Dashboard Showing Financial Chart and Analytics Image
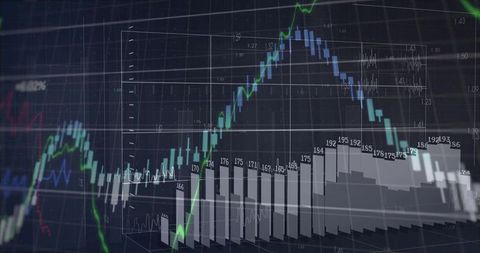
This visualization encapsulates the intricate elements of financial data displaying a line graph intertwined with a 3D bar chart and distinct waveforms. Perfect for presentations focused on market analysis, business growth strategies, or trading platforms. Ideal for illustrating concepts in financial reporting, economic forecasting, or educational resources dedicated to teaching fiscal dynamics.

downloads
Tags:
More
Credit Photo
If you would like to credit the Photo, here are some ways you can do so
Text Link
photo Link
<span class="text-link">
<span>
<a target="_blank" href=https://pikwizard.com/photo/digital-data-visualization-dashboard-showing-financial-chart-and-analytics/f6d71ed6f3c4730043def0fc5523d946/>PikWizard</a>
</span>
</span>
<span class="image-link">
<span
style="margin: 0 0 20px 0; display: inline-block; vertical-align: middle; width: 100%;"
>
<a
target="_blank"
href="https://pikwizard.com/photo/digital-data-visualization-dashboard-showing-financial-chart-and-analytics/f6d71ed6f3c4730043def0fc5523d946/"
style="text-decoration: none; font-size: 10px; margin: 0;"
>
<img src="https://pikwizard.com/pw/medium/f6d71ed6f3c4730043def0fc5523d946.jpg" style="margin: 0; width: 100%;" alt="" />
<p style="font-size: 12px; margin: 0;">PikWizard</p>
</a>
</span>
</span>
Free (free of charge)
Free for personal and commercial use.
Author: Authentic Images