
- Home >
- Stock Photos >
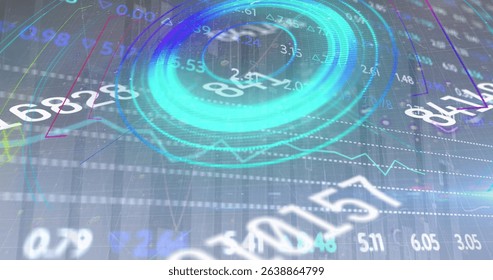
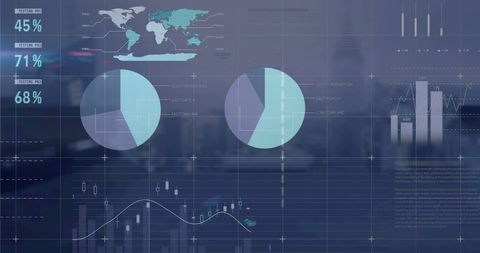
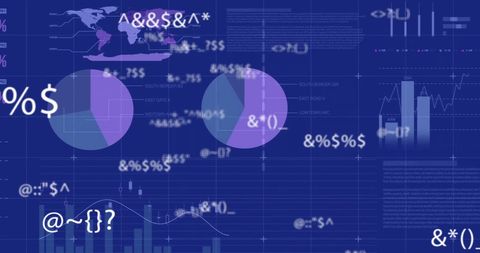
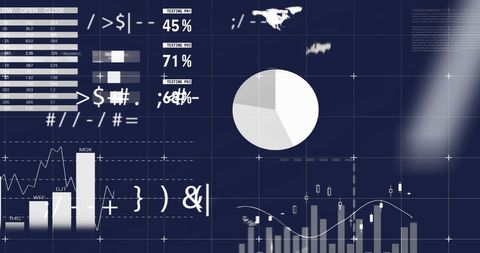
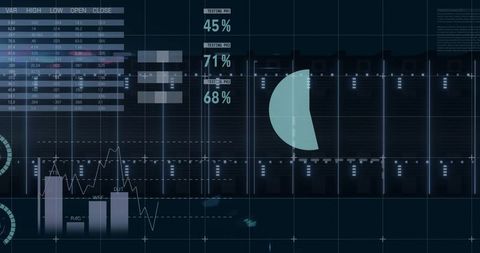
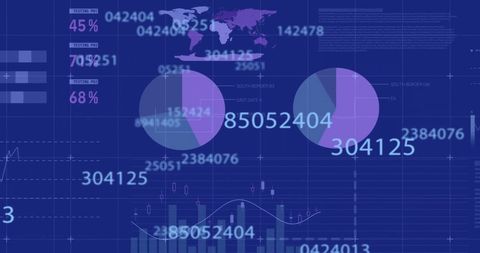
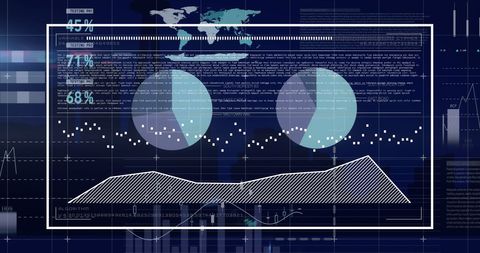
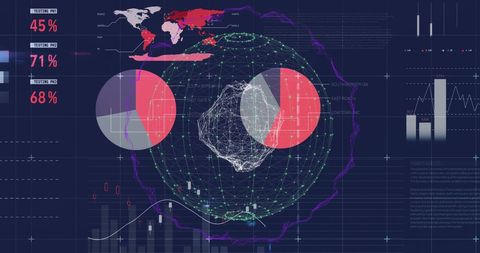
- Digital Data Visualization Financial Charts and Connections
Digital Data Visualization Financial Charts and Connections Image

Visual representation of economic and financial data using digital interface. Multiple charts, graphs and transparent numbers overlaid convey concepts of global finance and business analytics. Elements like pie charts and a world map signify connection and analysis in a networked economy. Ideal for presentations, illustrating data science methods, and use in analytics reports themed on economic trends or financial technologies.
Powered by  - Get 15% off with code: PIKWIZARD15


0
downloads
downloads
Tags:
More
Credit Photo
If you would like to credit the Photo, here are some ways you can do so
Text Link
photo Link
<span class="text-link">
<span>
<a target="_blank" href=https://pikwizard.com/photo/digital-data-visualization-financial-charts-and-connections/c581b49656e8083240d30dfac8850994/>PikWizard</a>
</span>
</span>
<span class="image-link">
<span
style="margin: 0 0 20px 0; display: inline-block; vertical-align: middle; width: 100%;"
>
<a
target="_blank"
href="https://pikwizard.com/photo/digital-data-visualization-financial-charts-and-connections/c581b49656e8083240d30dfac8850994/"
style="text-decoration: none; font-size: 10px; margin: 0;"
>
<img src="https://pikwizard.com/pw/medium/c581b49656e8083240d30dfac8850994.jpg" style="margin: 0; width: 100%;" alt="" />
<p style="font-size: 12px; margin: 0;">PikWizard</p>
</a>
</span>
</span>
Free (free of charge)
Free for personal and commercial use.
Author: Awesome Content
Similar Free Stock Images
Loading...

Premium


Premium


Premium


Premium


Premium


Premium


Premium
Premium


Premium


Premium


Premium


Premium


Premium


Premium


Premium


Premium


Premium


Premium


Premium


Premium


Premium


Premium


Premium


Premium


Premium
