
- Home >
- Stock Photos >
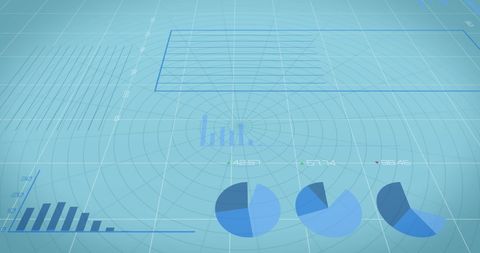
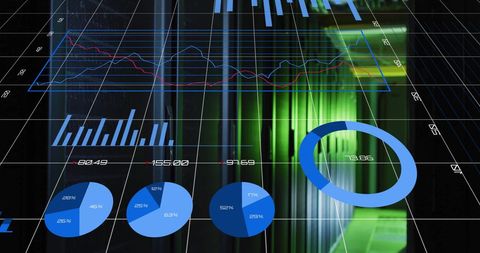
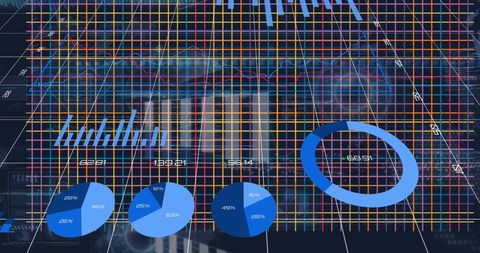
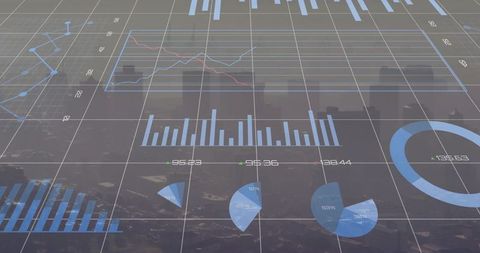
- Digital Data Visualization Interfaces and Infographics
Digital Data Visualization Interfaces and Infographics Image

Image depicting various charts and diagrams overlaid on geometric gray shapes, symbolizing data processing and digital interfaces. Suitable for illustrating concepts related to business analytics, statistical analysis, and information technology. Useful for presentations, reports, and digital technology articles focusing on data interpretation and visualization.
Powered by 


downloads
Tags:
More
Credit Photo
If you would like to credit the Photo, here are some ways you can do so
Text Link
photo Link
<span class="text-link">
<span>
<a target="_blank" href=https://pikwizard.com/photo/digital-data-visualization-interfaces-and-infographics/ef2073ddd84900be25ce5c06c289de00/>PikWizard</a>
</span>
</span>
<span class="image-link">
<span
style="margin: 0 0 20px 0; display: inline-block; vertical-align: middle; width: 100%;"
>
<a
target="_blank"
href="https://pikwizard.com/photo/digital-data-visualization-interfaces-and-infographics/ef2073ddd84900be25ce5c06c289de00/"
style="text-decoration: none; font-size: 10px; margin: 0;"
>
<img src="https://pikwizard.com/pw/medium/ef2073ddd84900be25ce5c06c289de00.jpg" style="margin: 0; width: 100%;" alt="" />
<p style="font-size: 12px; margin: 0;">PikWizard</p>
</a>
</span>
</span>
Free (free of charge)
Free for personal and commercial use.
Author: Authentic Images
Similar Free Stock Images

Premium


Premium

Premium


Premium


Premium

Premium


Premium


Premium


Premium


Premium


Premium


Premium


Premium

Premium

Premium


Premium

Premium


Premium


Premium

Premium

Premium

Premium


Premium

Premium


Premium


Explore More Free Stock Images