- Home >
- Stock Photos >
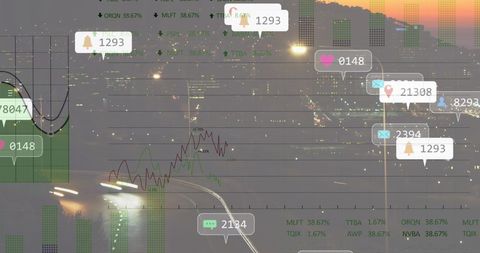
- Digital Data Visualization on Dark Grid Interface
Digital Data Visualization on Dark Grid Interface Image

Visual represents a high-tech digital interface showcasing data analytics with metric icons such as likes and numeric identifiers displayed on a dark gridded background. Curved lines symbolizing data patterns are overlaid, offering insight into real-time data monitoring and visualization. Ideal for use in presentations or articles related to data analysis, software capabilities, or explaining technology in an accessible way.

downloads
Tags:
More
Credit Photo
If you would like to credit the Photo, here are some ways you can do so
Text Link
photo Link
<span class="text-link">
<span>
<a target="_blank" href=https://pikwizard.com/photo/digital-data-visualization-on-dark-grid-interface/89092a481e351660846c5f84cfbee650/>PikWizard</a>
</span>
</span>
<span class="image-link">
<span
style="margin: 0 0 20px 0; display: inline-block; vertical-align: middle; width: 100%;"
>
<a
target="_blank"
href="https://pikwizard.com/photo/digital-data-visualization-on-dark-grid-interface/89092a481e351660846c5f84cfbee650/"
style="text-decoration: none; font-size: 10px; margin: 0;"
>
<img src="https://pikwizard.com/pw/medium/89092a481e351660846c5f84cfbee650.jpg" style="margin: 0; width: 100%;" alt="" />
<p style="font-size: 12px; margin: 0;">PikWizard</p>
</a>
</span>
</span>
Free (free of charge)
Free for personal and commercial use.
Author: People Creations