
- Home >
- Stock Photos >
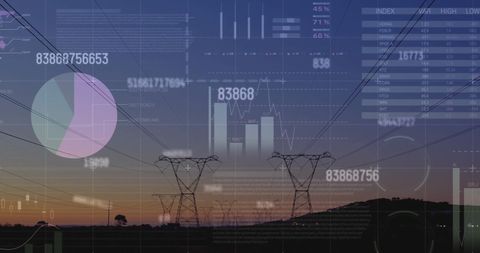
- Digital Data Visualization on Electricity Grid Lines at Sunset
Digital Data Visualization on Electricity Grid Lines at Sunset Image

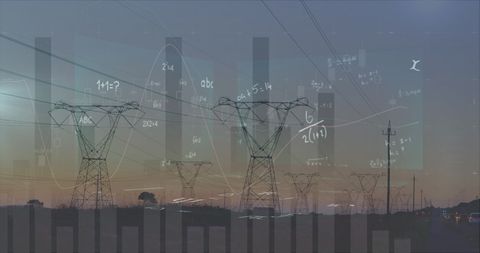
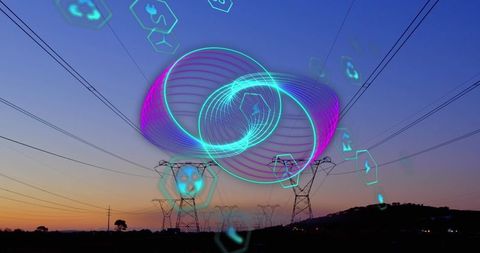
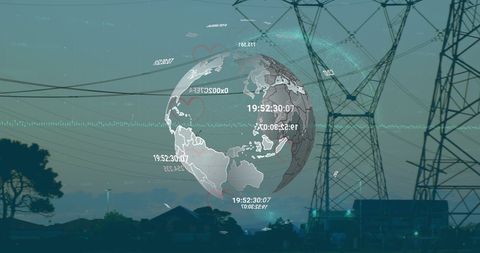
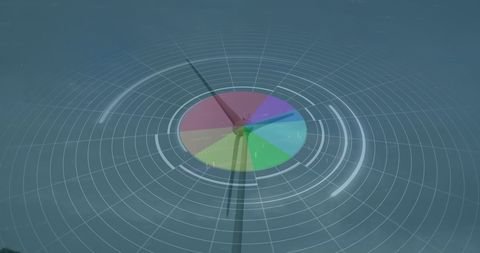
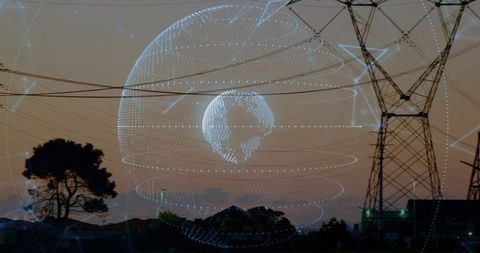
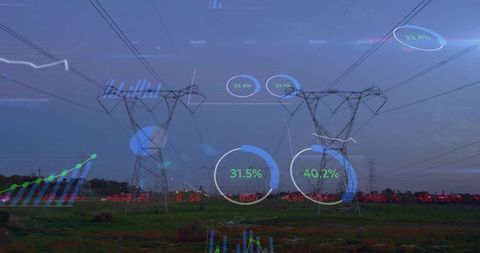
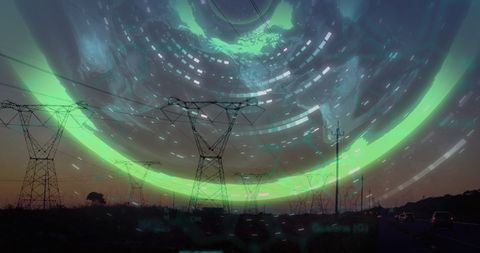
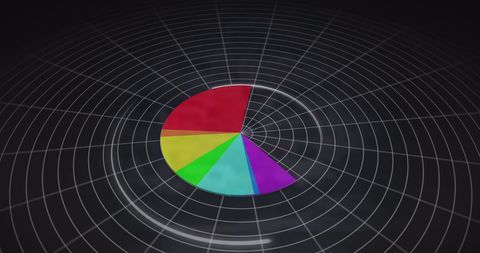
Conceptual representation of the intersection between energy and financial analytics. Overlaying pie charts on silhouetted power lines conveys the connectivity between electricity production and economic growth. Ideal for use in presentations, articles, and marketing material about energy forecasters, financial analytics, advances in economic technology.
Powered by 


downloads
Tags:
More
Credit Photo
If you would like to credit the Photo, here are some ways you can do so
Text Link
photo Link
<span class="text-link">
<span>
<a target="_blank" href=https://pikwizard.com/photo/digital-data-visualization-on-electricity-grid-lines-at-sunset/f51c4230e169ed97227c6d1631cdadef/>PikWizard</a>
</span>
</span>
<span class="image-link">
<span
style="margin: 0 0 20px 0; display: inline-block; vertical-align: middle; width: 100%;"
>
<a
target="_blank"
href="https://pikwizard.com/photo/digital-data-visualization-on-electricity-grid-lines-at-sunset/f51c4230e169ed97227c6d1631cdadef/"
style="text-decoration: none; font-size: 10px; margin: 0;"
>
<img src="https://pikwizard.com/pw/medium/f51c4230e169ed97227c6d1631cdadef.jpg" style="margin: 0; width: 100%;" alt="" />
<p style="font-size: 12px; margin: 0;">PikWizard</p>
</a>
</span>
</span>
Free (free of charge)
Free for personal and commercial use.
Author: Awesome Content
Similar Free Stock Images

Premium


Premium


Premium

Premium


Premium

Premium


Premium


Premium


Premium

Premium


Premium


Premium


Premium

Premium


Premium


Premium

Premium


Premium

Premium


Premium


Premium

Premium


Premium


Premium


Premium


Explore More Free Stock Images