
- Home >
- Stock Photos >
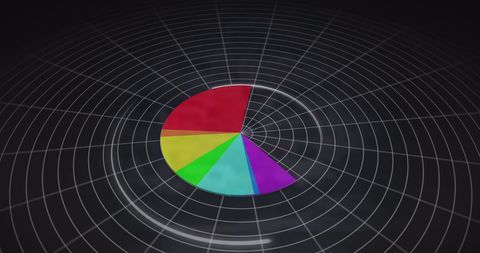
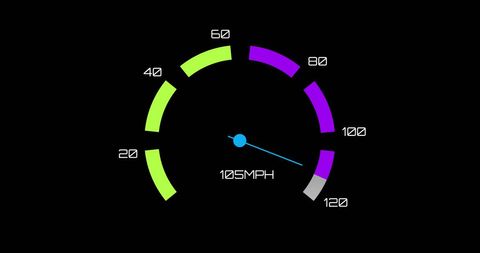
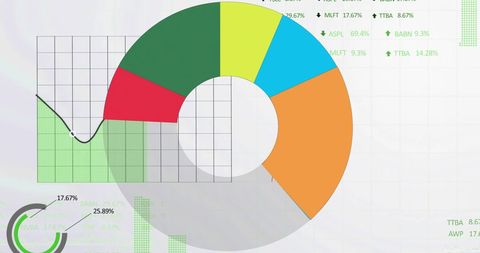
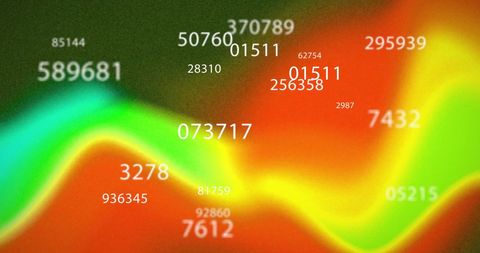
- Digital Data Visualization on Green Circular Dashboard
Digital Data Visualization on Green Circular Dashboard Image
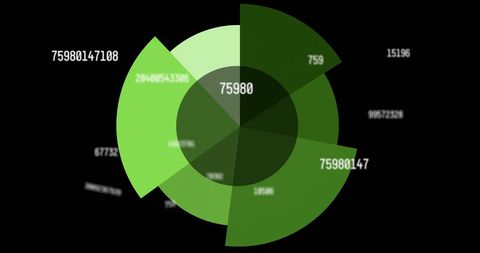
Abstract representation of complex data metrics seen on circular dashboard with dominant green hues. Ideal for presentations, technology-related content, business analytics demonstrations, or any digital workflow context to convey data-heavy information processing and communication.
Powered by  - Get 15% off with code: PIKWIZARD15


downloads
Tags:
More
Credit Photo
If you would like to credit the Photo, here are some ways you can do so
Text Link
photo Link
<span class="text-link">
<span>
<a target="_blank" href=https://pikwizard.com/photo/digital-data-visualization-on-green-circular-dashboard/bb17c63d592de9290187e3105f734ad8/>PikWizard</a>
</span>
</span>
<span class="image-link">
<span
style="margin: 0 0 20px 0; display: inline-block; vertical-align: middle; width: 100%;"
>
<a
target="_blank"
href="https://pikwizard.com/photo/digital-data-visualization-on-green-circular-dashboard/bb17c63d592de9290187e3105f734ad8/"
style="text-decoration: none; font-size: 10px; margin: 0;"
>
<img src="https://pikwizard.com/pw/medium/bb17c63d592de9290187e3105f734ad8.jpg" style="margin: 0; width: 100%;" alt="" />
<p style="font-size: 12px; margin: 0;">PikWizard</p>
</a>
</span>
</span>
Free (free of charge)
Free for personal and commercial use.
Author: People Creations
Similar Free Stock Images

Premium


Premium

Premium


Premium


Premium


Premium


Premium


Premium


Premium

Premium


Premium


Premium


Premium


Premium


Premium


AI


Premium


Premium


AI

Premium


Premium


Premium


Premium


Premium


Premium


Premium


Premium

Explore More Free Stock Images