- Home >
- Stock Photos >
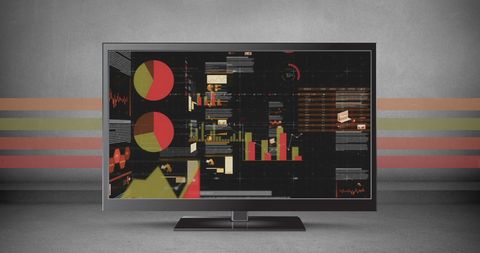
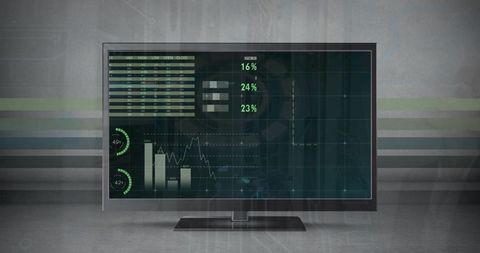
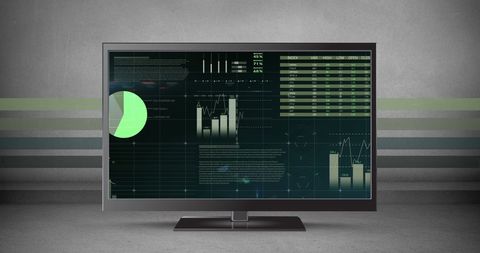
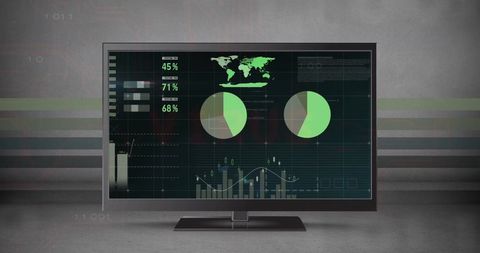
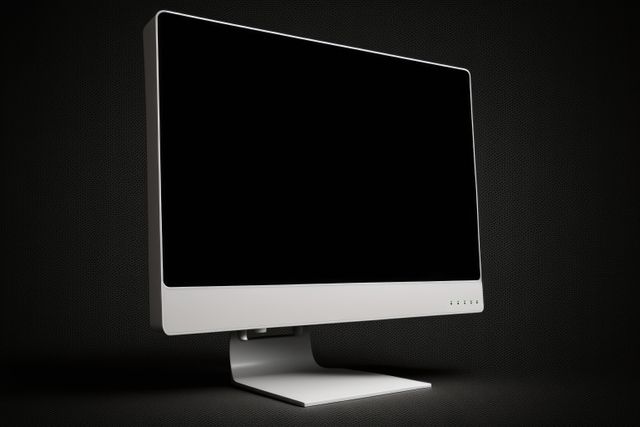
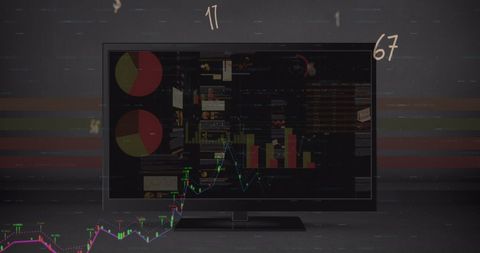
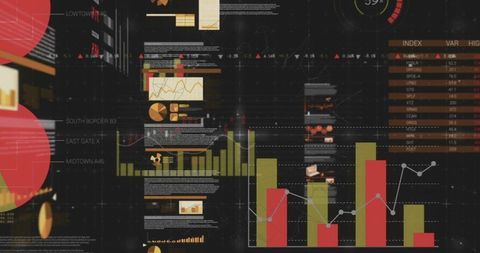
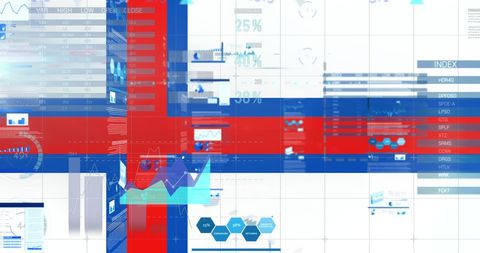
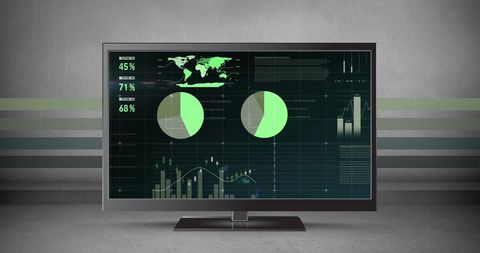
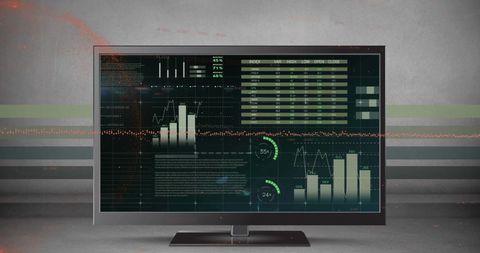
- Digital Data Visualization on Monitor Analysis Interface
Digital Data Visualization on Monitor Analysis Interface Image
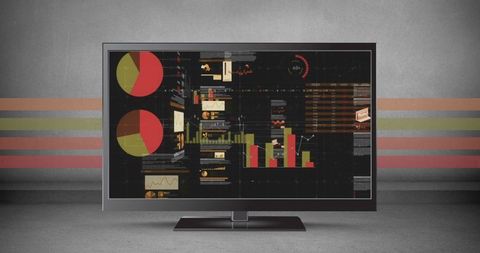
Display features complex array of charts and graphs showing digital data analytics on a computer monitor. Can be used for illustrating technology and data processing concepts in presentations, articles on digital interfaces or showcasing advancements in computer technology.
Powered by 


downloads
Tags:
More
Credit Photo
If you would like to credit the Photo, here are some ways you can do so
Text Link
photo Link
<span class="text-link">
<span>
<a target="_blank" href=https://pikwizard.com/photo/digital-data-visualization-on-monitor-analysis-interface/4ca9ce6ab5b244f297b1fa4c7ea25049/>PikWizard</a>
</span>
</span>
<span class="image-link">
<span
style="margin: 0 0 20px 0; display: inline-block; vertical-align: middle; width: 100%;"
>
<a
target="_blank"
href="https://pikwizard.com/photo/digital-data-visualization-on-monitor-analysis-interface/4ca9ce6ab5b244f297b1fa4c7ea25049/"
style="text-decoration: none; font-size: 10px; margin: 0;"
>
<img src="https://pikwizard.com/pw/medium/4ca9ce6ab5b244f297b1fa4c7ea25049.jpg" style="margin: 0; width: 100%;" alt="" />
<p style="font-size: 12px; margin: 0;">PikWizard</p>
</a>
</span>
</span>
Free (free of charge)
Free for personal and commercial use.
Author: Creative Art
Similar Free Stock Images
Loading...


Premium


Premium


Premium


Premium


Premium


Premium


Premium

Premium


Premium


Premium


Premium


Premium


Premium


Premium


Premium


Premium


Premium


Premium


Premium


Premium


Premium


Premium


Premium


Premium


Premium