- Home >
- Stock Photos >
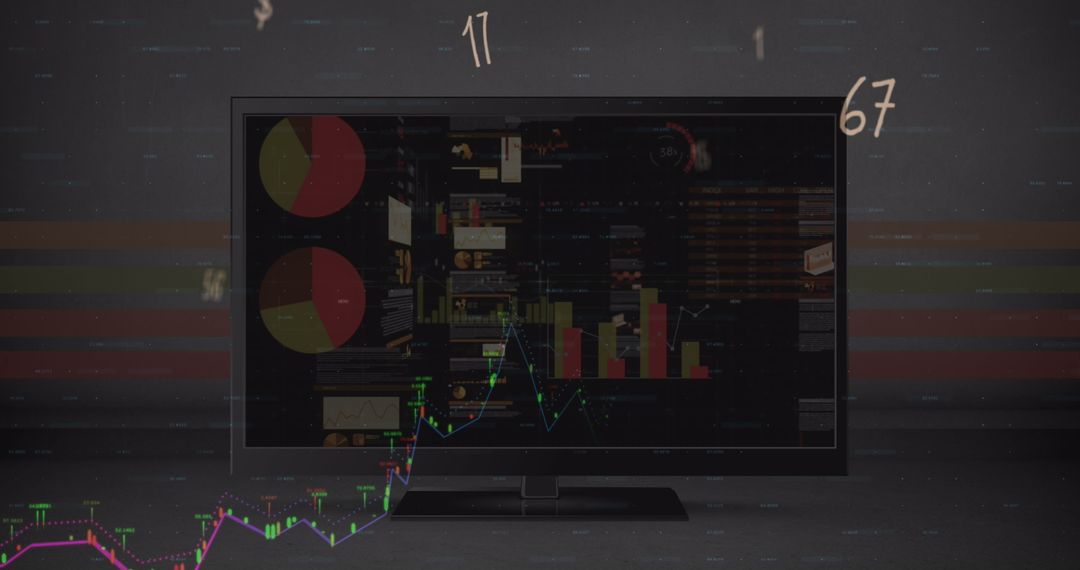
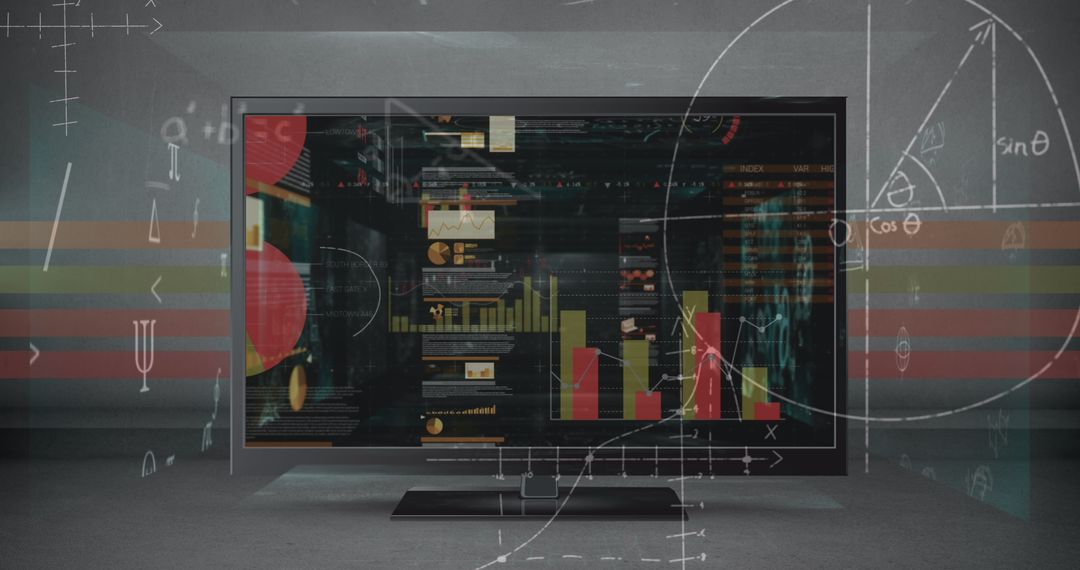
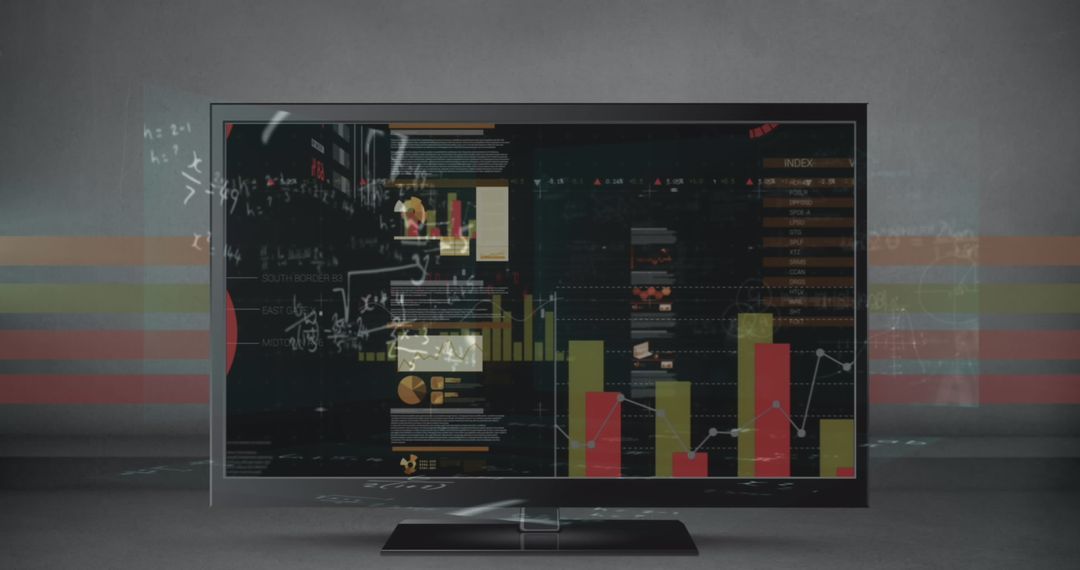
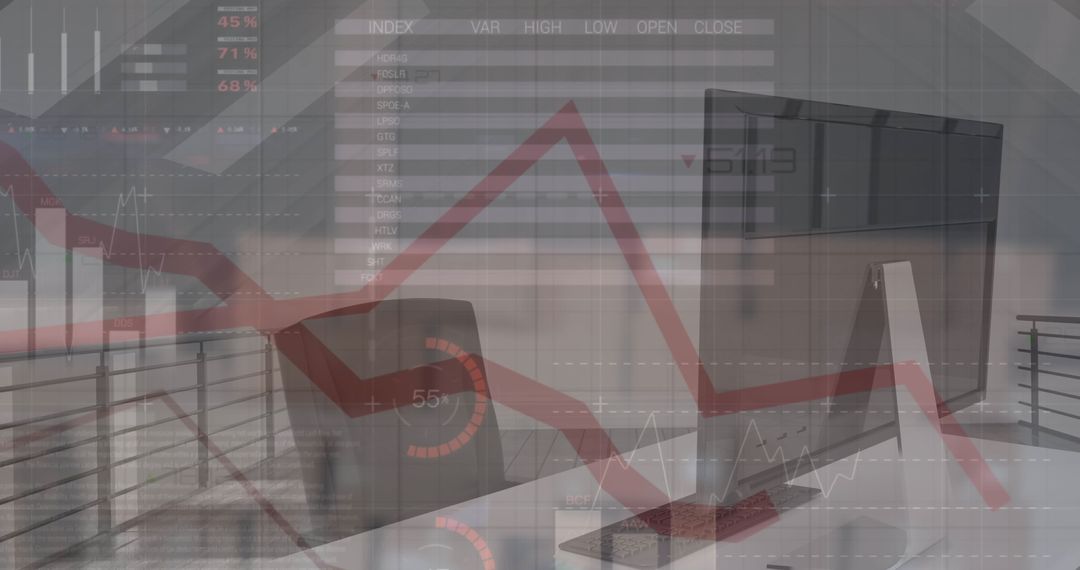
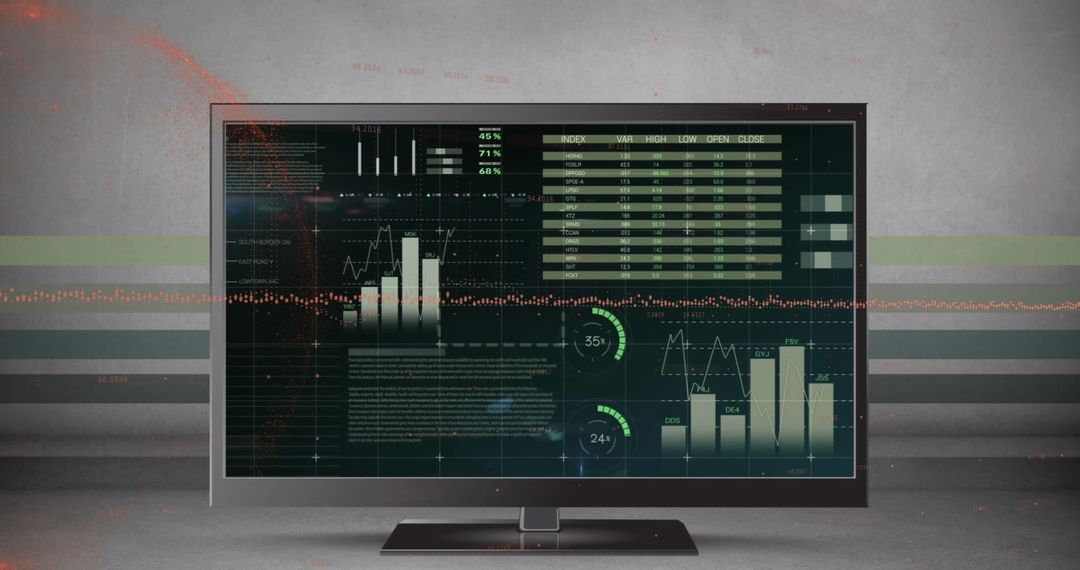
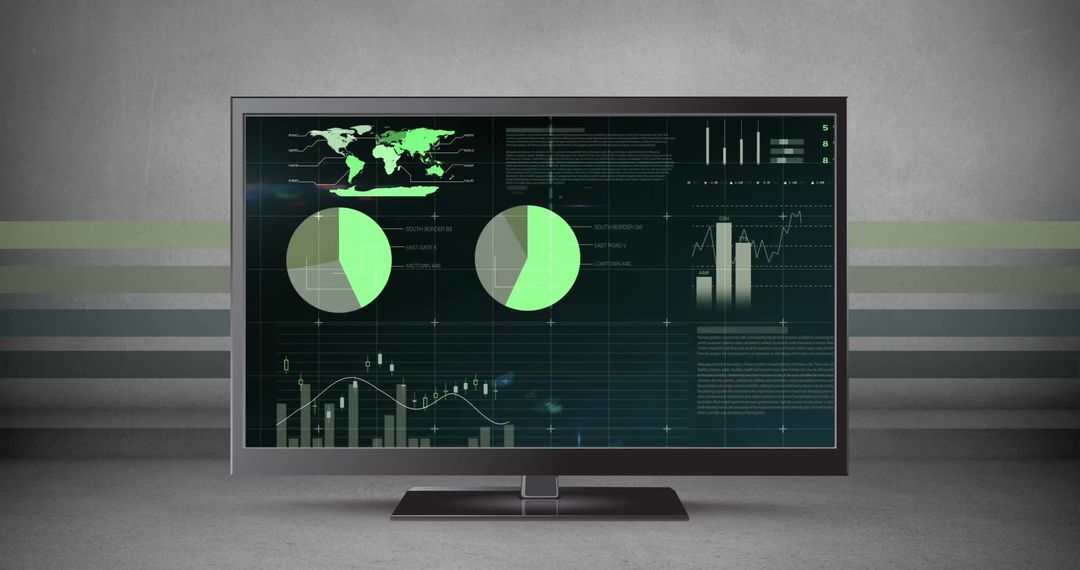
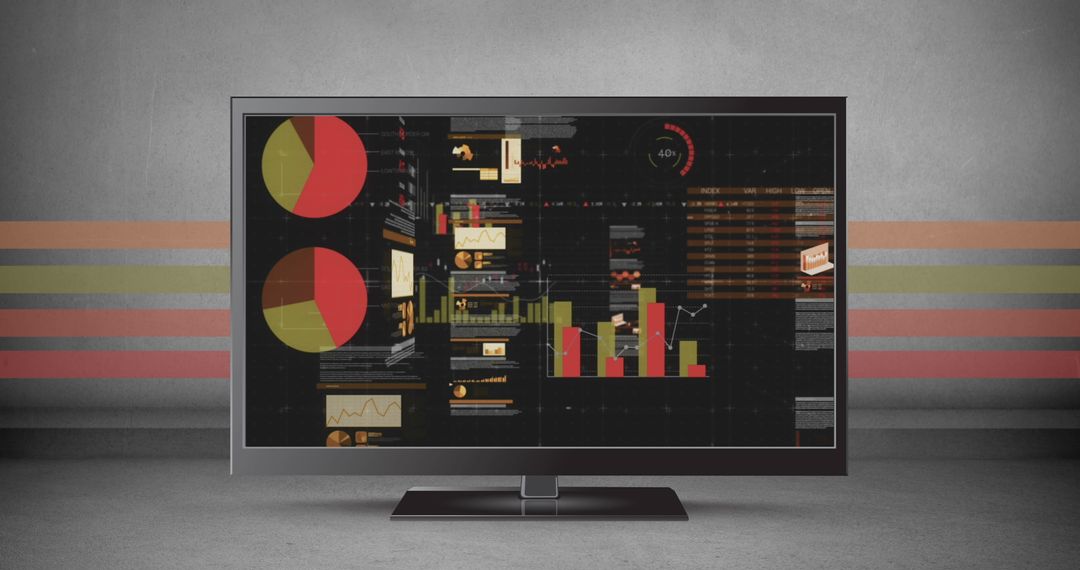
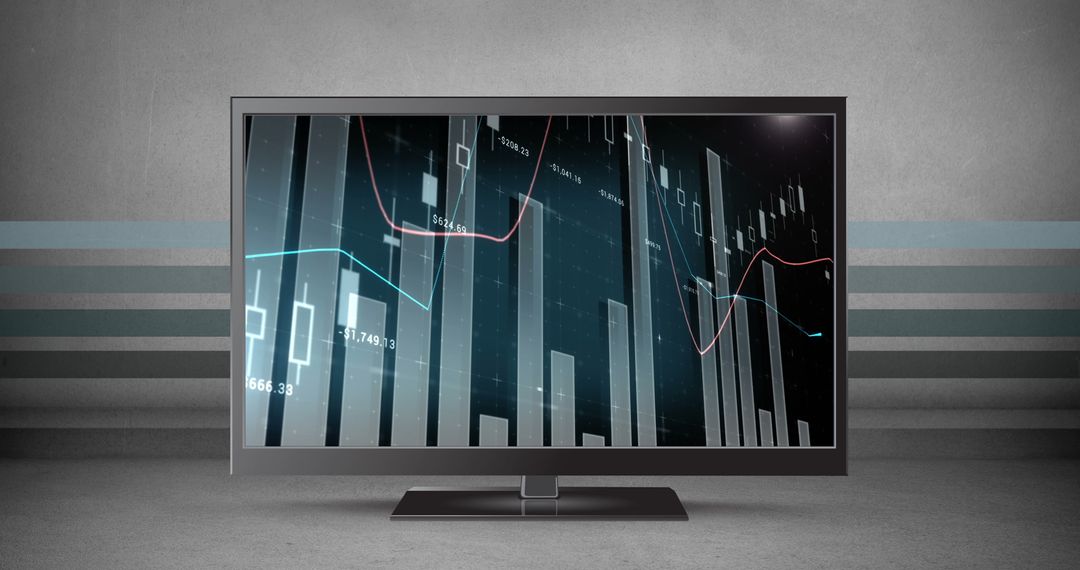
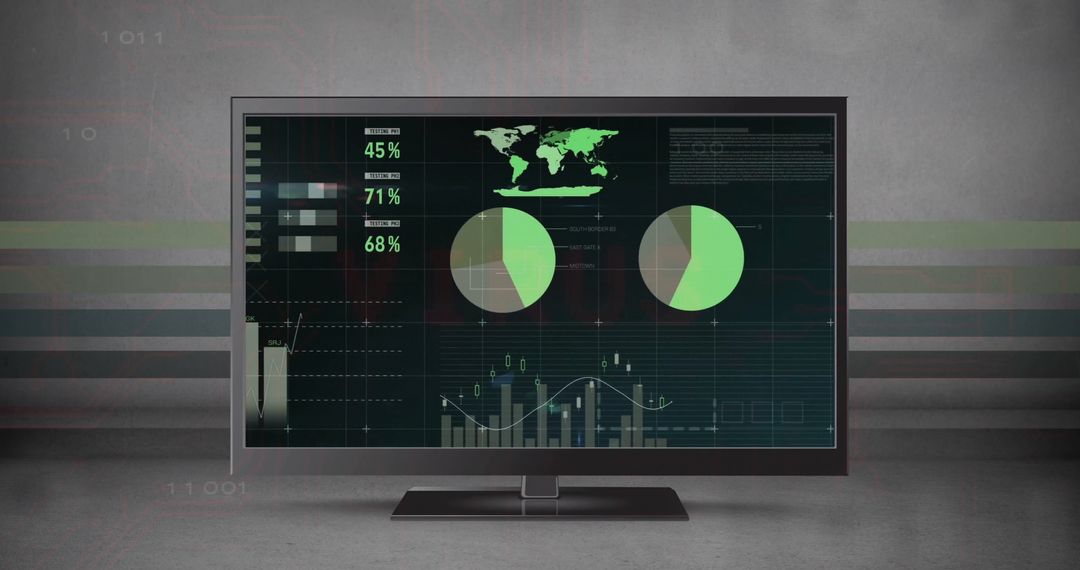
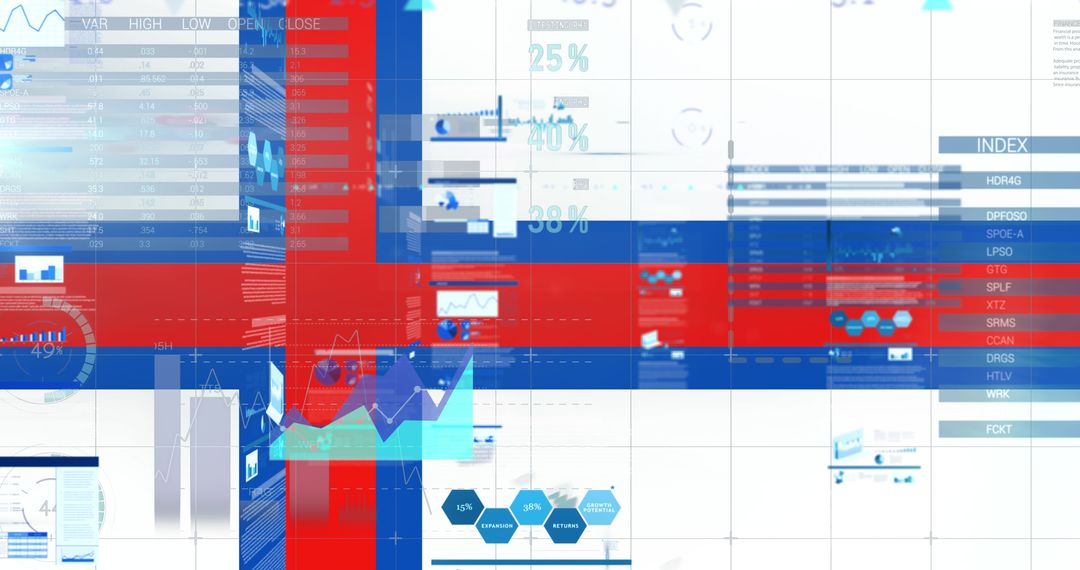
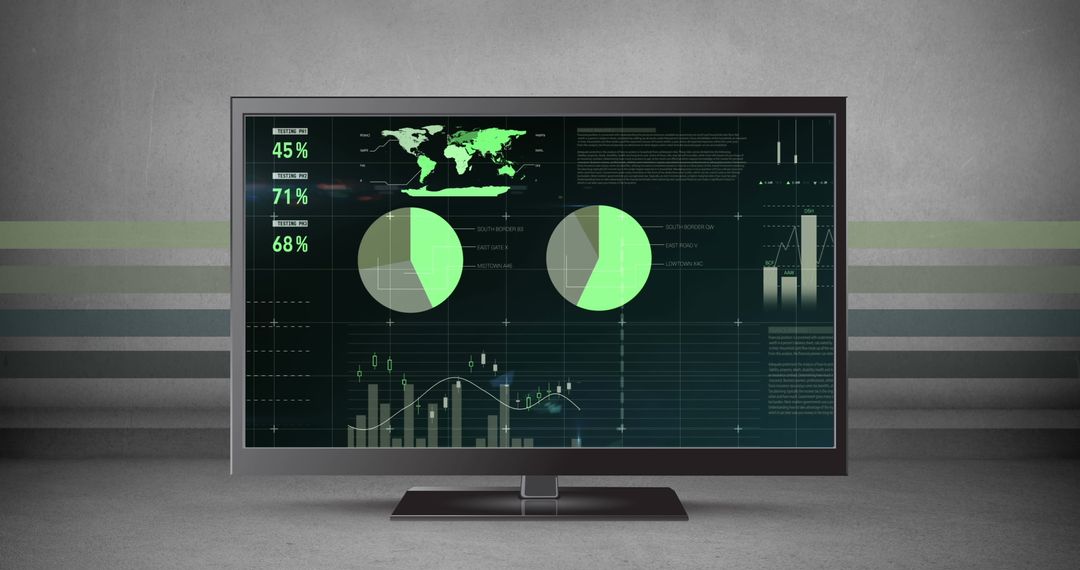
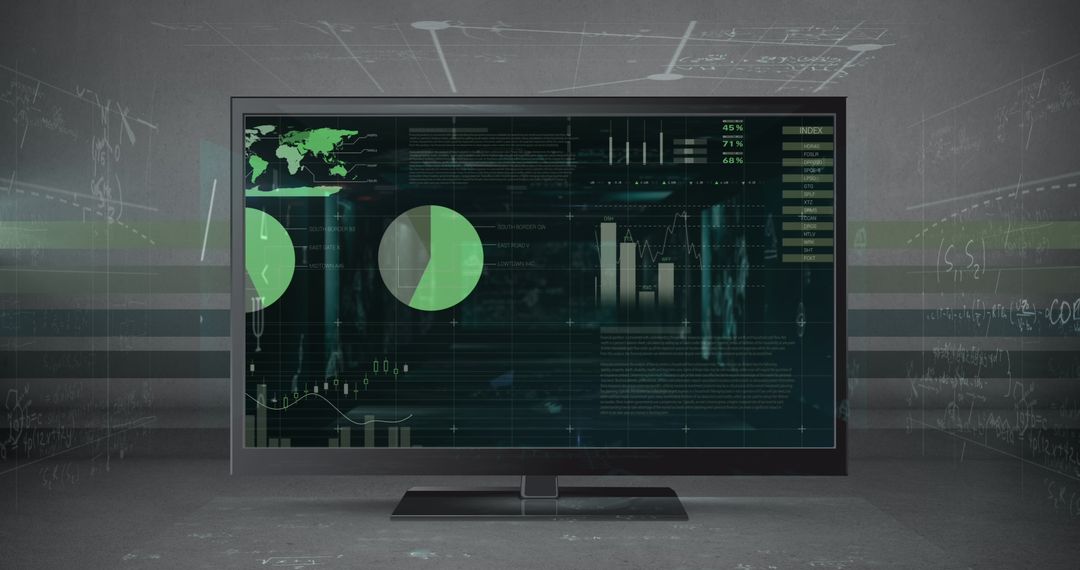
- Digital Data Visualization on Monitor with Financial Graphs
Digital Data Visualization on Monitor with Financial Graphs Image
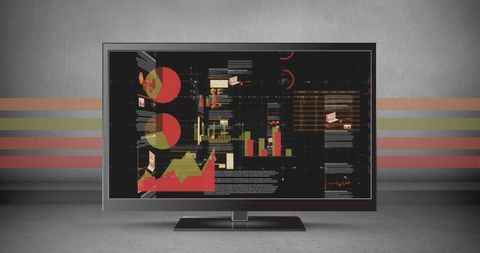
This image displays a monitor showing various complex graphs and data visualizations often used in finance, technology, and analytics. It can be effectively utilized to convey concepts related to data processing, financial forecasts, global economy, and technological advancements. Ideal for presentations, reports, and online content focused on big data and quantitative analysis.
Powered by  - Get 15% off with code: PIKWIZARD15


2
downloads
downloads
Tags:
More
Credit Photo
If you would like to credit the Photo, here are some ways you can do so
Text Link
photo Link
<span class="text-link">
<span>
<a target="_blank" href=https://pikwizard.com/photo/digital-data-visualization-on-monitor-with-financial-graphs/c9db96d5994d9e71e556ec527cc85f81/>PikWizard</a>
</span>
</span>
<span class="image-link">
<span
style="margin: 0 0 20px 0; display: inline-block; vertical-align: middle; width: 100%;"
>
<a
target="_blank"
href="https://pikwizard.com/photo/digital-data-visualization-on-monitor-with-financial-graphs/c9db96d5994d9e71e556ec527cc85f81/"
style="text-decoration: none; font-size: 10px; margin: 0;"
>
<img src="https://pikwizard.com/pw/medium/c9db96d5994d9e71e556ec527cc85f81.jpg" style="margin: 0; width: 100%;" alt="" />
<p style="font-size: 12px; margin: 0;">PikWizard</p>
</a>
</span>
</span>
Free (free of charge)
Free for personal and commercial use.
Author: People Creations
Similar Free Stock Images

Premium


Premium


Premium


Premium


Premium


Premium


Premium


Premium


Premium


Premium


Premium


Premium


Premium


Premium


Premium


Premium


Premium


Premium


Premium


Premium


Premium


Premium


Premium


Premium