
- Home >
- Stock Photos >
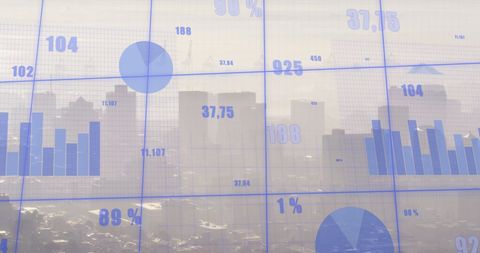
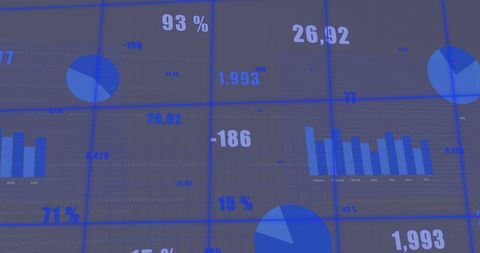
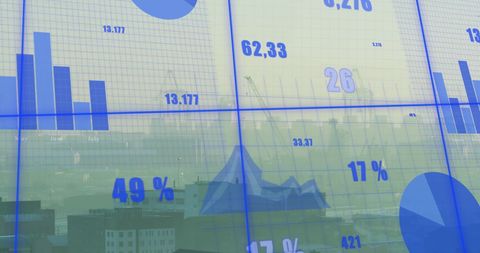
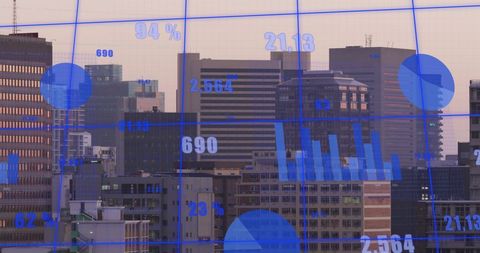
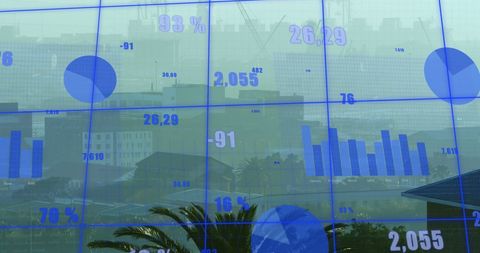
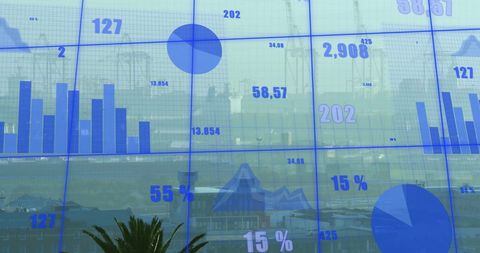
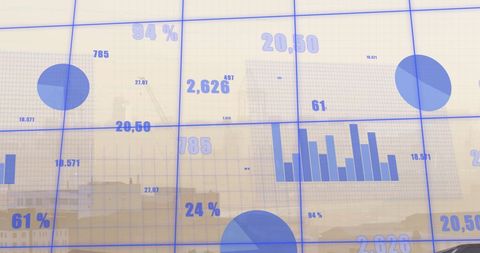
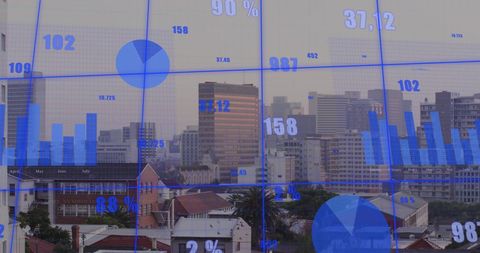
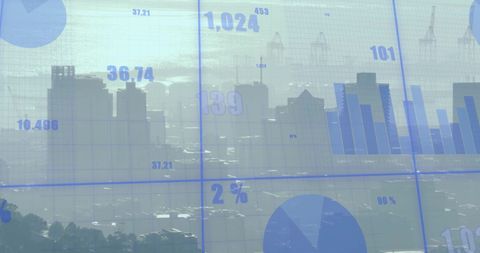
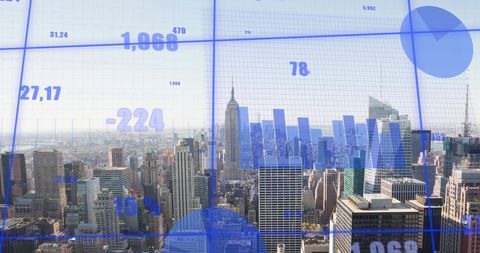
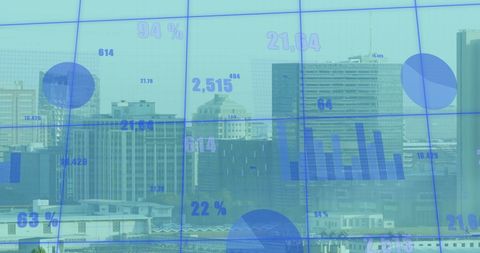
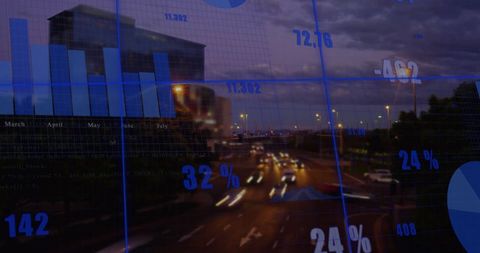
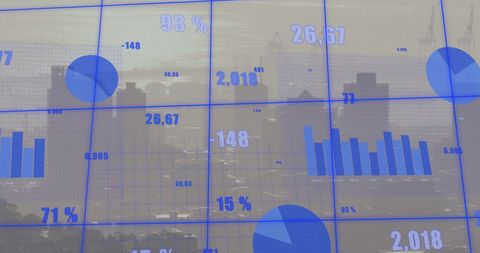
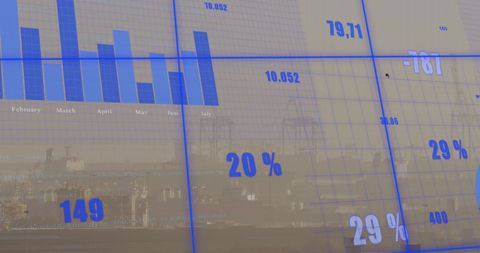
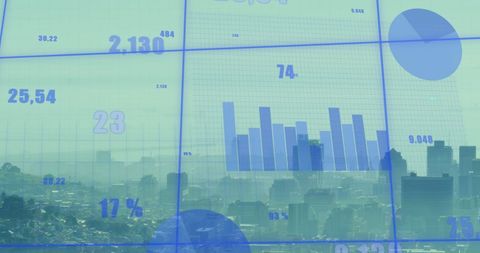
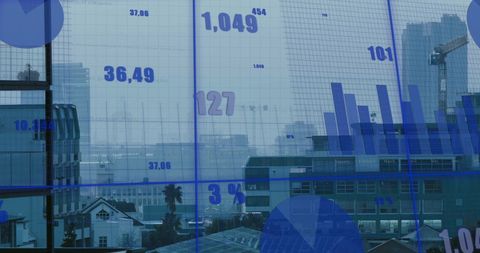
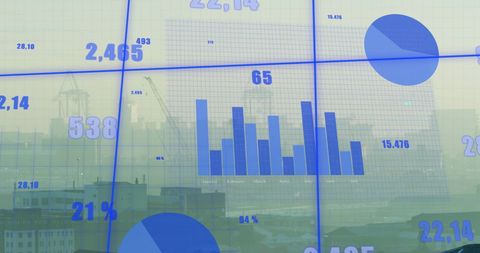
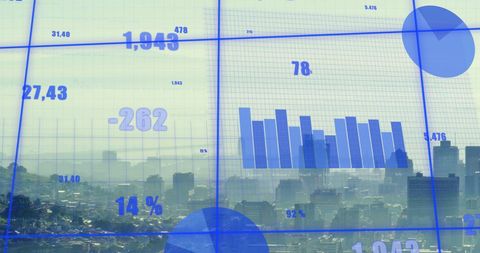
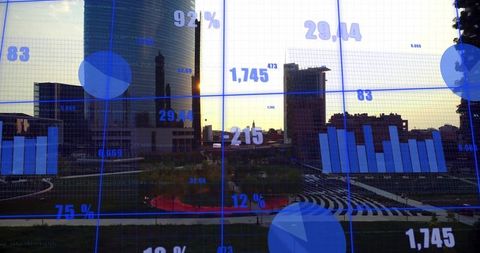
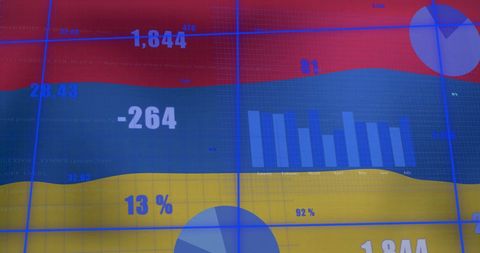
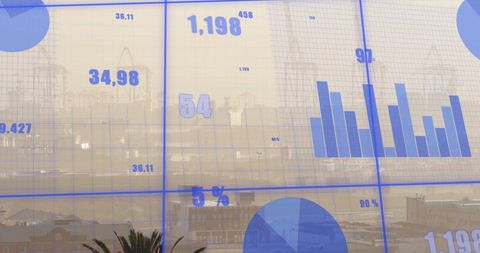
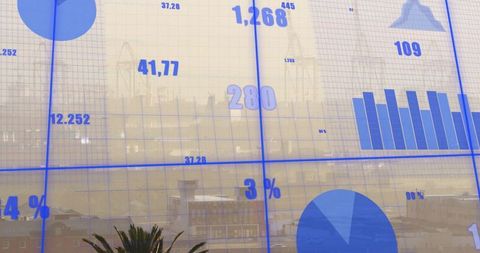
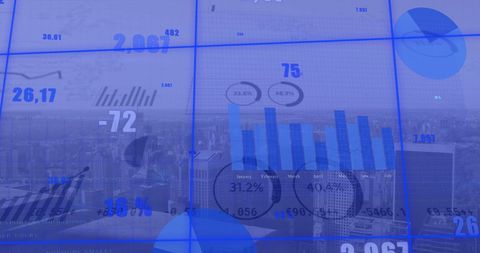
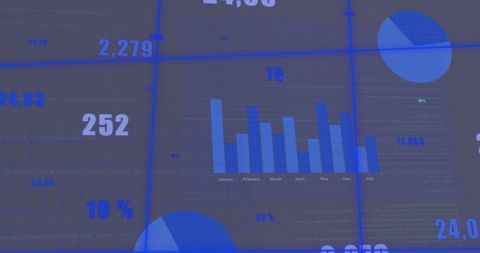
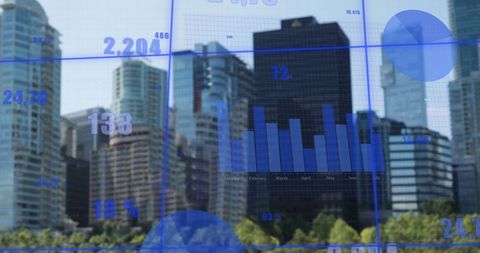
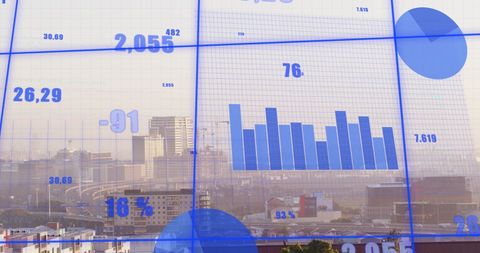
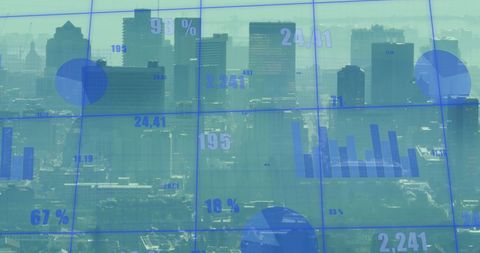
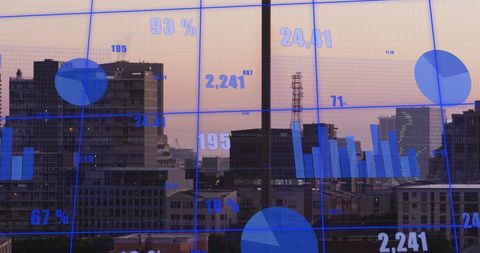
- Digital Data Visualization Over Urban Skyline with Statistics
Digital Data Visualization Over Urban Skyline with Statistics Image

Digital interfaces projecting statistical information on an urban skyline. Bar charts and percentages suggest economic or financial data use. Ideal for illustrating advanced technology articles, business intelligence content, and data analysis coverage.
Powered by  - Get 15% off with code: PIKWIZARD15


downloads
Tags:
More
Credit Photo
If you would like to credit the Photo, here are some ways you can do so
Text Link
photo Link
<span class="text-link">
<span>
<a target="_blank" href=https://pikwizard.com/photo/digital-data-visualization-over-urban-skyline-with-statistics/9abe97d91c699950c93f42eb9a58ee5b/>PikWizard</a>
</span>
</span>
<span class="image-link">
<span
style="margin: 0 0 20px 0; display: inline-block; vertical-align: middle; width: 100%;"
>
<a
target="_blank"
href="https://pikwizard.com/photo/digital-data-visualization-over-urban-skyline-with-statistics/9abe97d91c699950c93f42eb9a58ee5b/"
style="text-decoration: none; font-size: 10px; margin: 0;"
>
<img src="https://pikwizard.com/pw/medium/9abe97d91c699950c93f42eb9a58ee5b.jpg" style="margin: 0; width: 100%;" alt="" />
<p style="font-size: 12px; margin: 0;">PikWizard</p>
</a>
</span>
</span>
Free (free of charge)
Free for personal and commercial use.
Author: Creative Art
Similar Free Stock Images

Premium


Premium

Premium


Premium


Premium


Premium


Premium

Premium


Premium


Premium


Premium


Premium

Premium


Premium

Premium


Premium


Premium


Premium

Premium


Premium


Premium


Premium


Premium


Premium

Premium

Explore More Free Stock Images