- Home >
- Stock Photos >
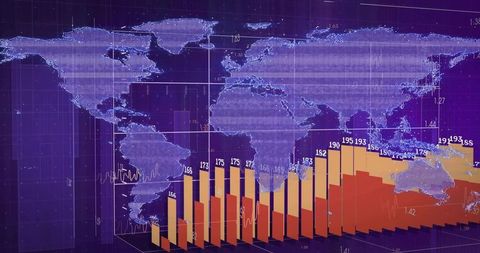
- Digital Data Visualization Over World Map
Digital Data Visualization Over World Map Image

This image depicts digital data processing overlaid on a world map, highlighting technology and computing themes. It features abstract digital icons and grids, conveying concepts of global analytics and interface. Perfect for illustrating digital trends, tech presentations, or business publications that focus on international data networks.

downloads
Tags:
Credit Photo
If you would like to credit the Photo, here are some ways you can do so
Text Link
photo Link
<span class="text-link">
<span>
<a target="_blank" href=https://pikwizard.com/photo/digital-data-visualization-over-world-map/99447bcdab45e4d3c30f8438b8d3bb1c/>PikWizard</a>
</span>
</span>
<span class="image-link">
<span
style="margin: 0 0 20px 0; display: inline-block; vertical-align: middle; width: 100%;"
>
<a
target="_blank"
href="https://pikwizard.com/photo/digital-data-visualization-over-world-map/99447bcdab45e4d3c30f8438b8d3bb1c/"
style="text-decoration: none; font-size: 10px; margin: 0;"
>
<img src="https://pikwizard.com/pw/medium/99447bcdab45e4d3c30f8438b8d3bb1c.jpg" style="margin: 0; width: 100%;" alt="" />
<p style="font-size: 12px; margin: 0;">PikWizard</p>
</a>
</span>
</span>
Free (free of charge)
Free for personal and commercial use.
Author: People Creations