
- Home >
- Stock Photos >
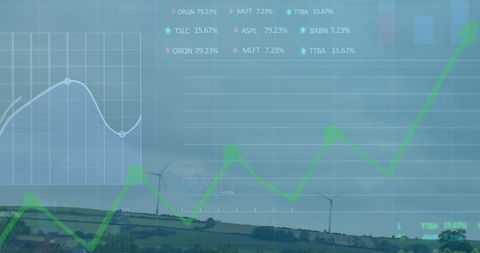
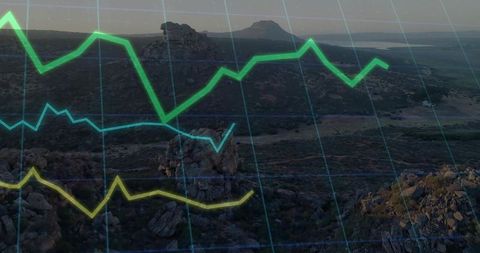
- Digital Data Visualization Overlapping Wind Energy Landscape
Digital Data Visualization Overlapping Wind Energy Landscape Image
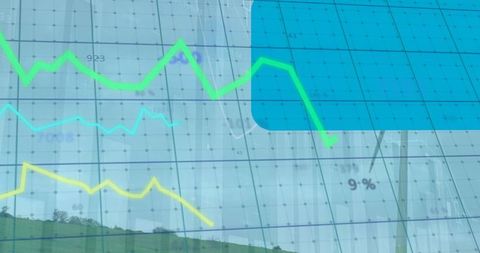
Digital graphs showing analytics overlay lush landscape with wind turbines scattered across grassy hills. Concepts of renewable energy, eco-friendly technology, and sustainability. Ideal for illustrating topics of green technology development, innovation in renewable resources, and depicting the intersection of modern data analytics with natural environments.
Powered by  - Get 15% off with code: PIKWIZARD15


downloads
Tags:
More
Credit Photo
If you would like to credit the Photo, here are some ways you can do so
Text Link
photo Link
<span class="text-link">
<span>
<a target="_blank" href=https://pikwizard.com/photo/digital-data-visualization-overlapping-wind-energy-landscape/6c37dfb5480f32243d5ba742ccbaf9d0/>PikWizard</a>
</span>
</span>
<span class="image-link">
<span
style="margin: 0 0 20px 0; display: inline-block; vertical-align: middle; width: 100%;"
>
<a
target="_blank"
href="https://pikwizard.com/photo/digital-data-visualization-overlapping-wind-energy-landscape/6c37dfb5480f32243d5ba742ccbaf9d0/"
style="text-decoration: none; font-size: 10px; margin: 0;"
>
<img src="https://pikwizard.com/pw/medium/6c37dfb5480f32243d5ba742ccbaf9d0.jpg" style="margin: 0; width: 100%;" alt="" />
<p style="font-size: 12px; margin: 0;">PikWizard</p>
</a>
</span>
</span>
Free (free of charge)
Free for personal and commercial use.
Author: Creative Art
Similar Free Stock Images

Premium


Premium


Premium


Premium


Premium

Premium


Premium


Premium

Premium


Premium


Premium


Premium


Premium


Premium


Premium

Premium

Premium


Premium


Premium


Premium


Premium


Premium


Premium


Premium


Premium


Explore More Free Stock Images