
- Home >
- Stock Photos >
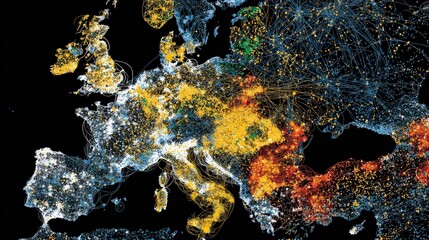
- Digital Data Visualization Overlay on Europe's Map
Digital Data Visualization Overlay on Europe's Map Image

This complex image illustrates a high-tech approach to mapping, showcasing various data points and numerical values projected over a map of Europe. Ideal for use in tech blogs, presentations on data analytics, and geographic information system studies, it visually represents the integration of technology and geographical analysis. Suitable for expressing ideas in articles related to business intelligence or illustrating concepts during technology conferences.
Powered by 


downloads
Tags:
More
Credit Photo
If you would like to credit the Photo, here are some ways you can do so
Text Link
photo Link
<span class="text-link">
<span>
<a target="_blank" href=https://pikwizard.com/photo/digital-data-visualization-overlay-on-europes-map/26221cea72463f6a22d75b7ca49d4077/>PikWizard</a>
</span>
</span>
<span class="image-link">
<span
style="margin: 0 0 20px 0; display: inline-block; vertical-align: middle; width: 100%;"
>
<a
target="_blank"
href="https://pikwizard.com/photo/digital-data-visualization-overlay-on-europes-map/26221cea72463f6a22d75b7ca49d4077/"
style="text-decoration: none; font-size: 10px; margin: 0;"
>
<img src="https://pikwizard.com/pw/medium/26221cea72463f6a22d75b7ca49d4077.jpg" style="margin: 0; width: 100%;" alt="" />
<p style="font-size: 12px; margin: 0;">PikWizard</p>
</a>
</span>
</span>
Free (free of charge)
Free for personal and commercial use.
Author: Awesome Content
Similar Free Stock Images

Premium


Premium


Premium


Premium


Premium

Premium


Premium


Premium


Premium


Premium


Premium


Premium


Premium


Premium


Premium


Premium

Premium


Premium


Premium


Premium


Premium

Premium

Premium


Premium


Premium


Explore More Free Stock Images