
- Home >
- Stock Photos >
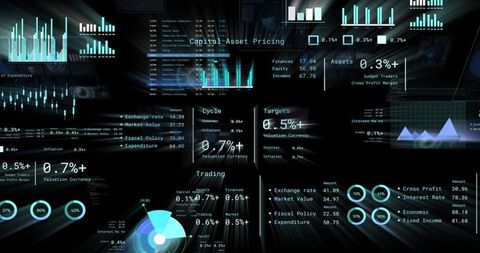
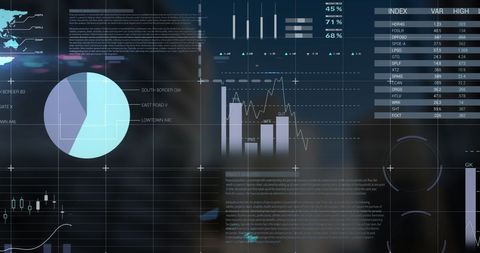
- Digital Data Visualization Overlay with Graphs and Charts
Digital Data Visualization Overlay with Graphs and Charts Image

This visualization displays vivid graphs and pie charts on a cutting-edge, futuristic interface, layered over mathematical equations. Ideal for illustrating technology-driven data solutions, analytical processes in finance, or digital transformations. Useful for presentations or websites showcasing modern analytical techniques or tech innovations.
Powered by  - Get 15% off with code: PIKWIZARD15


downloads
Tags:
More
Credit Photo
If you would like to credit the Photo, here are some ways you can do so
Text Link
photo Link
<span class="text-link">
<span>
<a target="_blank" href=https://pikwizard.com/photo/digital-data-visualization-overlay-with-graphs-and-charts/967a7905f91413f8e61f02303e555312/>PikWizard</a>
</span>
</span>
<span class="image-link">
<span
style="margin: 0 0 20px 0; display: inline-block; vertical-align: middle; width: 100%;"
>
<a
target="_blank"
href="https://pikwizard.com/photo/digital-data-visualization-overlay-with-graphs-and-charts/967a7905f91413f8e61f02303e555312/"
style="text-decoration: none; font-size: 10px; margin: 0;"
>
<img src="https://pikwizard.com/pw/medium/967a7905f91413f8e61f02303e555312.jpg" style="margin: 0; width: 100%;" alt="" />
<p style="font-size: 12px; margin: 0;">PikWizard</p>
</a>
</span>
</span>
Free (free of charge)
Free for personal and commercial use.
Author: Awesome Content
Similar Free Stock Images
Loading...

Premium


Premium


Premium


Premium


Premium


Premium


Premium


Premium


Premium


Premium

Premium


Premium


Premium


Premium

Premium


Premium


Premium


Premium


Premium


Premium


Premium


Premium


Premium


Premium


Premium

Explore More Free Stock Images