- Home >
- Stock Photos >
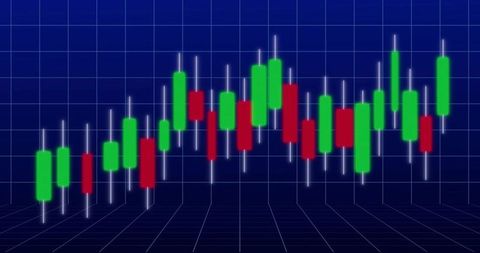
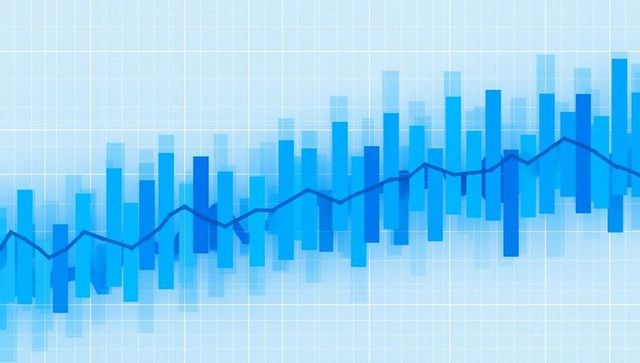
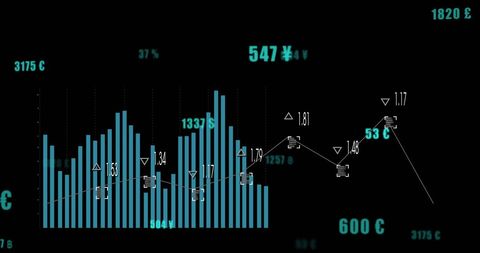
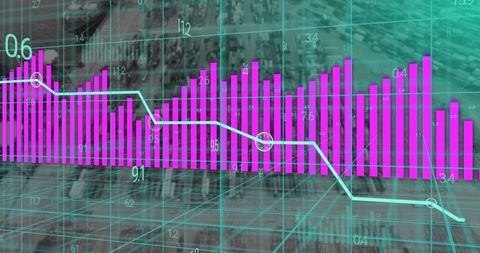
- Digital Data Visualization with 3D Bar Graph
Digital Data Visualization with 3D Bar Graph Image

This is a dynamic scene of a 3D bar graph displayed on a grid, suggesting a high-tech approach to data analytics. Ideal for materials related to global business meetings, financial reports, tech announcements, or corporate presentations. The visual can enhance discussions on data trends, economic analyses, and the innovative use of technology in business analytics.

downloads
Tags:
More
Credit Photo
If you would like to credit the Photo, here are some ways you can do so
Text Link
photo Link
<span class="text-link">
<span>
<a target="_blank" href=https://pikwizard.com/photo/digital-data-visualization-with-3d-bar-graph/9d41ab88b7b513a4f1d920756fcbe401/>PikWizard</a>
</span>
</span>
<span class="image-link">
<span
style="margin: 0 0 20px 0; display: inline-block; vertical-align: middle; width: 100%;"
>
<a
target="_blank"
href="https://pikwizard.com/photo/digital-data-visualization-with-3d-bar-graph/9d41ab88b7b513a4f1d920756fcbe401/"
style="text-decoration: none; font-size: 10px; margin: 0;"
>
<img src="https://pikwizard.com/pw/medium/9d41ab88b7b513a4f1d920756fcbe401.jpg" style="margin: 0; width: 100%;" alt="" />
<p style="font-size: 12px; margin: 0;">PikWizard</p>
</a>
</span>
</span>
Free (free of charge)
Free for personal and commercial use.
Author: Authentic Images