
- Home >
- Stock Photos >
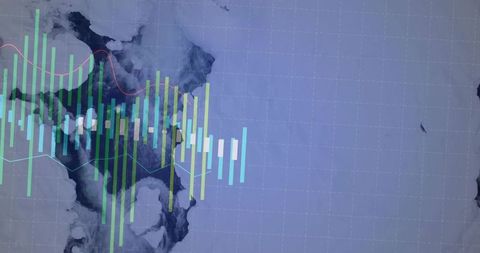
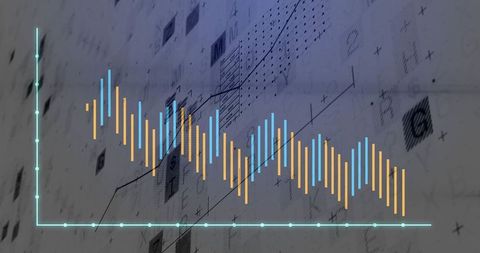
- Digital Data Visualization with Bars and Waveforms
Digital Data Visualization with Bars and Waveforms Image

Visualizing digital data using bars, waveforms, and line traces can effectively represent knowledge, stats, or changes. Ideal for illustrating analytical reports, technology guides, or advancements in digital analytics tools.
Powered by  - Get 15% off with code: PIKWIZARD15


downloads
Tags:
More
Credit Photo
If you would like to credit the Photo, here are some ways you can do so
Text Link
photo Link
<span class="text-link">
<span>
<a target="_blank" href=https://pikwizard.com/photo/digital-data-visualization-with-bars-and-waveforms/f34e47b0180c2a9e0d069ef5a0481b51/>PikWizard</a>
</span>
</span>
<span class="image-link">
<span
style="margin: 0 0 20px 0; display: inline-block; vertical-align: middle; width: 100%;"
>
<a
target="_blank"
href="https://pikwizard.com/photo/digital-data-visualization-with-bars-and-waveforms/f34e47b0180c2a9e0d069ef5a0481b51/"
style="text-decoration: none; font-size: 10px; margin: 0;"
>
<img src="https://pikwizard.com/pw/medium/f34e47b0180c2a9e0d069ef5a0481b51.jpg" style="margin: 0; width: 100%;" alt="" />
<p style="font-size: 12px; margin: 0;">PikWizard</p>
</a>
</span>
</span>
Free (free of charge)
Free for personal and commercial use.
Author: People Creations
Similar Free Stock Images

Premium


Premium

Premium


Premium


Premium


Premium


Premium


Premium

Premium


Premium

Premium

Premium


Premium


Premium


Premium

Premium


Premium


Premium


Premium


Premium

Premium

Premium


Premium


Premium


Premium


Explore More Free Stock Images