- Home >
- Stock Photos >
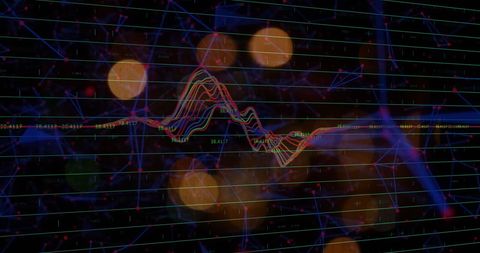
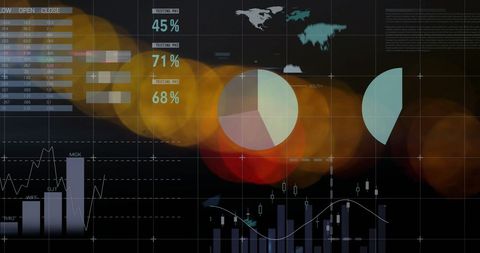
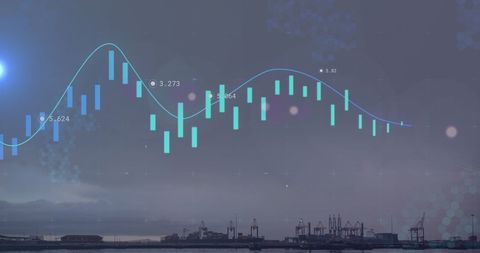
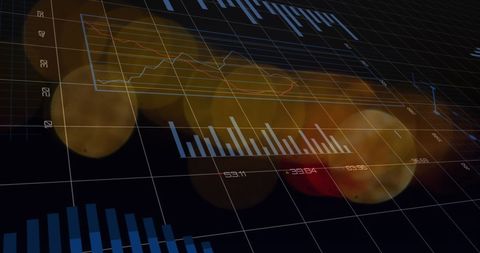
- Digital Data Visualization with Binary Matrix Patterns
Digital Data Visualization with Binary Matrix Patterns Image
Abstract visualization of digital data with binary codes and financial charts overlaying each other. Binary numbers interwoven with green candlestick charts indicate technology-driven components in financial analytics. Use for global business presentations, tech-oriented reports, or materials focusing on data-driven strategies and digital growth concepts.

downloads
Tags:
More
Credit Photo
If you would like to credit the Photo, here are some ways you can do so
Text Link
photo Link
<span class="text-link">
<span>
<a target="_blank" href=https://pikwizard.com/photo/digital-data-visualization-with-binary-matrix-patterns/5ebb2d1756278773b7458067b8bcb0c3/>PikWizard</a>
</span>
</span>
<span class="image-link">
<span
style="margin: 0 0 20px 0; display: inline-block; vertical-align: middle; width: 100%;"
>
<a
target="_blank"
href="https://pikwizard.com/photo/digital-data-visualization-with-binary-matrix-patterns/5ebb2d1756278773b7458067b8bcb0c3/"
style="text-decoration: none; font-size: 10px; margin: 0;"
>
<img src="https://pikwizard.com/pw/medium/5ebb2d1756278773b7458067b8bcb0c3.jpg" style="margin: 0; width: 100%;" alt="" />
<p style="font-size: 12px; margin: 0;">PikWizard</p>
</a>
</span>
</span>
Free (free of charge)
Free for personal and commercial use.
Author: People Creations