
- Home >
- Stock Photos >
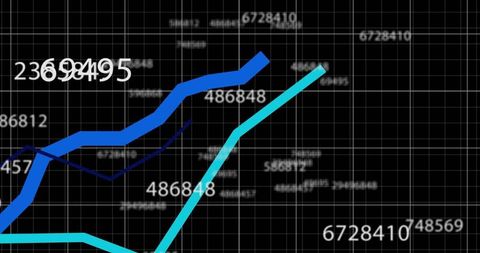
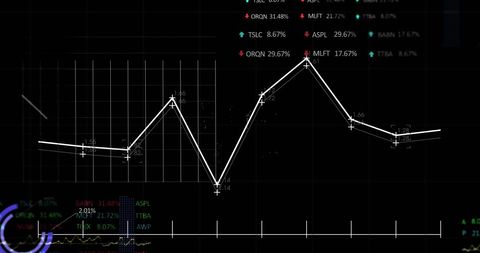
- Digital Data Visualization with Charts and Graphs
Digital Data Visualization with Charts and Graphs Image
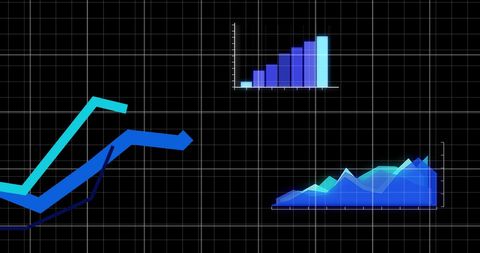
Image represents a digital dashboard featuring various charts and graphs. Ideal for use in business presentations, technology blogs, or articles focused on data analysis and information technology trends. Blue tones add a modern, professional touch, making it suitable for corporate communications or educational materials about statistics and data insight.
Powered by 


downloads
Tags:
More
Credit Photo
If you would like to credit the Photo, here are some ways you can do so
Text Link
photo Link
<span class="text-link">
<span>
<a target="_blank" href=https://pikwizard.com/photo/digital-data-visualization-with-charts-and-graphs/73c89a3291edeb02c76bd29a212f03ed/>PikWizard</a>
</span>
</span>
<span class="image-link">
<span
style="margin: 0 0 20px 0; display: inline-block; vertical-align: middle; width: 100%;"
>
<a
target="_blank"
href="https://pikwizard.com/photo/digital-data-visualization-with-charts-and-graphs/73c89a3291edeb02c76bd29a212f03ed/"
style="text-decoration: none; font-size: 10px; margin: 0;"
>
<img src="https://pikwizard.com/pw/medium/73c89a3291edeb02c76bd29a212f03ed.jpg" style="margin: 0; width: 100%;" alt="" />
<p style="font-size: 12px; margin: 0;">PikWizard</p>
</a>
</span>
</span>
Free (free of charge)
Free for personal and commercial use.
Author: Creative Art
Similar Free Stock Images

Premium


Premium

Premium


Premium


Premium


Premium


Premium


Premium

Premium

Premium


Premium


Premium


Premium


Premium


Premium


Premium


Premium


Premium


Premium


Premium


Premium

Premium


Premium


Premium


Premium


Explore More Free Stock Images