
- Home >
- Stock Photos >
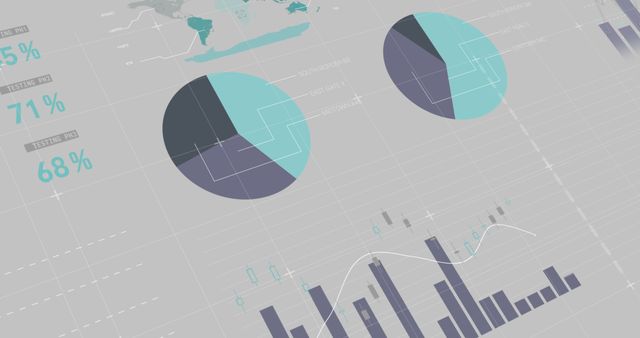
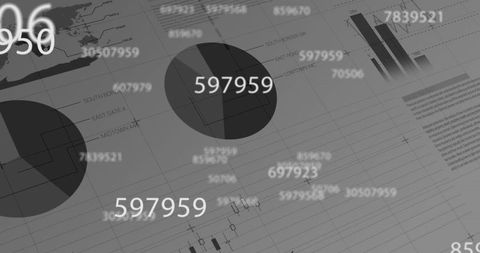
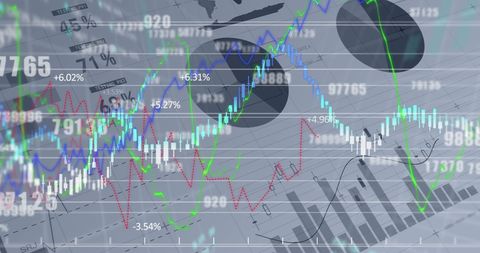
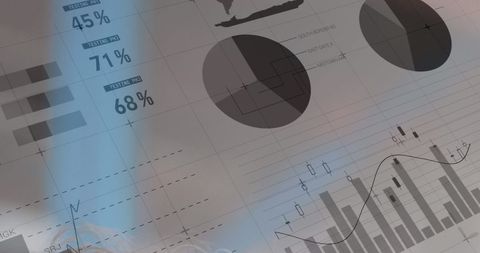
- Digital Data Visualization with Charts and Numbers Concept
Digital Data Visualization with Charts and Numbers Concept Image

Digitally generated scene of statistical data plotted on dark background, representing financial and business world. Featuring pie and bar graphs with numeric data overlay, perfect for advertisements and promotional content related to finance, tech firms, and global communications. Ideal for educational materials focused on data processing and business analytics advancements.
Powered by 


downloads
Tags:
More
Credit Photo
If you would like to credit the Photo, here are some ways you can do so
Text Link
photo Link
<span class="text-link">
<span>
<a target="_blank" href=https://pikwizard.com/photo/digital-data-visualization-with-charts-and-numbers-concept/ccd9a4bb56f99d34ce8623ab12f572bd/>PikWizard</a>
</span>
</span>
<span class="image-link">
<span
style="margin: 0 0 20px 0; display: inline-block; vertical-align: middle; width: 100%;"
>
<a
target="_blank"
href="https://pikwizard.com/photo/digital-data-visualization-with-charts-and-numbers-concept/ccd9a4bb56f99d34ce8623ab12f572bd/"
style="text-decoration: none; font-size: 10px; margin: 0;"
>
<img src="https://pikwizard.com/pw/medium/ccd9a4bb56f99d34ce8623ab12f572bd.jpg" style="margin: 0; width: 100%;" alt="" />
<p style="font-size: 12px; margin: 0;">PikWizard</p>
</a>
</span>
</span>
Free (free of charge)
Free for personal and commercial use.
Author: Awesome Content
Similar Free Stock Images

Premium


Premium

Premium

Premium


Premium


Premium

Premium


Premium

Premium


Premium

Premium

Premium


Premium


Premium


Premium


Premium


Premium

Premium

Premium


Premium


Premium


Premium


Premium


Premium


Premium


Explore More Free Stock Images