1. Home > 
  2. Stock Photos > 
  3. Digital Data Visualization with DNA Strand Overlaying Graphs

Digital Data Visualization with DNA Strand Overlaying Graphs Image

Digital Data Visualization with DNA Strand Overlaying Graphs

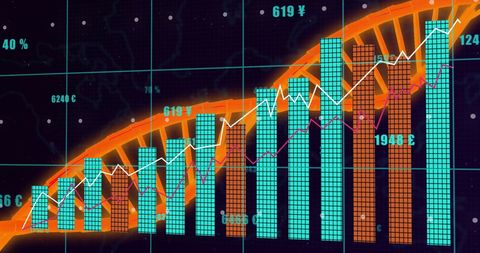
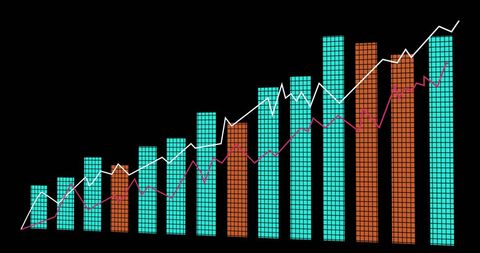
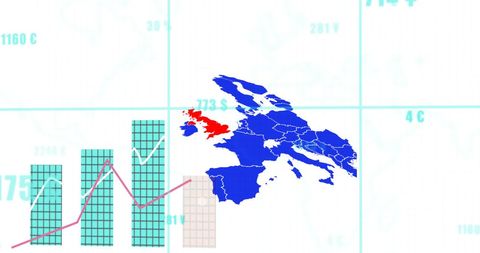
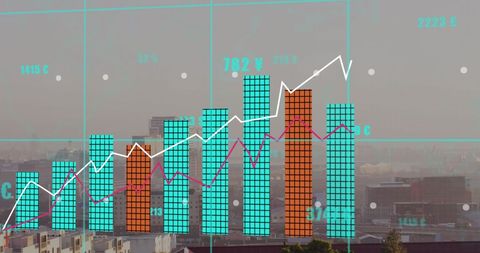
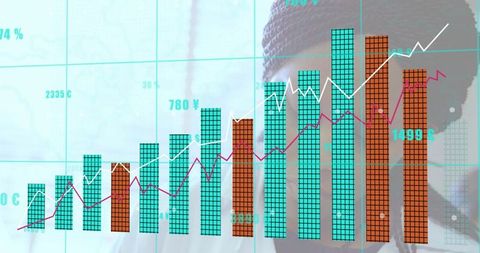
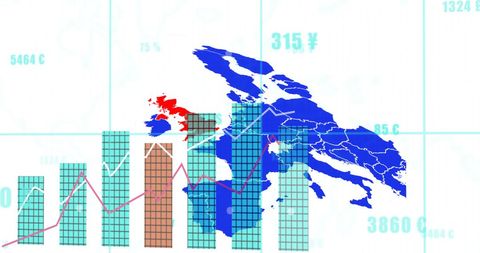
Visually representing the synergy between genetic research and financial data, this imagery features an overlay of a DNA strand and graphs on a digital grid background. Ideal for illustrating concepts in biotechnology, financial markets, or the fusion of science and data management, this image can be used in articles, presentations, or reports that focus on innovative data analysis, genetic advancements, or market trends. The bright colors and dynamic composition emphasize innovation and progress.

Powered by Shutterstock logo - Get 15% off with code: PIKWIZARD15
Image of dna strand spinning and data processing on blue background. Global science, computing and data processing concept digitally generated image. - Powered by Shutterstock - Get 15% off with code: PIKWIZARD15Composite of human brain, dna strands, binary coding and data processing. Global networks, science, computing and data processing concept digitally generated image. - Powered by Shutterstock - Get 15% off with code: PIKWIZARD15Composition of dna strand over binary coding data processing. Global science, computing and data processing concept digitally generated video. - Powered by Shutterstock - Get 15% off with code: PIKWIZARD15Composition of dna strand over binary coding data processing. Global science, computing and data processing concept digitally generated video. - Powered by Shutterstock - Get 15% off with code: PIKWIZARD15Composition of dna strand and data processing. Global science, computing and data processing concept digitally generated image. - Powered by Shutterstock - Get 15% off with code: PIKWIZARD15

Credit Photo

If you would like to credit the Photo, here are some ways you can do so

Free (free of charge)

Free for personal and commercial use.

Author: Awesome Content

Similar Free Stock Images

Abstract Financial Data and Graph Analysis on Digital Screen
Premium
Composition of dna strand over binary coding data processing. Global science, computing and data processing concept digitally generated video.
Digital Healthcare Data Visualization with Virus Cells During Pandemic
Dynamic Data Processing with Digital Interface Elements
Financial Graph Analysis for Global Business Insights
Digital Financial Analysis with Soaring Graphs and Statistics
Abstract Global Data Analytics on Blue World Map
Global Financial Growth Trends Visualization with Data Graphs
Abstract Financial Data and Trends Analysis
Digital Data Analytics Showing Bar Graph and Curves on Black Background
Financial Data Processing Over Cityscape Digital Interface
Financial Data Visualization with Futuristic Bars and Lines
Businessman Analyzing Complex Digital Data Interface
Futuristic Financial Trading Graph and Data Visualization
Financial Data and Stock Market Analysis with Cityscape
Futuristic Data and Financial Analysis in Modern Office Environment
Soaring Follower Count with Digital Data Growth Indicators
Digital Financial Growth with Rising Bar and Line Graphs
Dynamic Financial Growth Chart with Digital Data Streams
Analyzing Complex Financial Data in Digital Display
Futuristic Data Analytics Visualization with Graph and DNA Strand
Digital Graph Illustrating Financial Data Analysis Trends
Network of Medical Icons and Technical Charts on Digital Interface
Futuristic Data Dashboard with Bar Charts and Trend Lines
Digital Financial Analysis Dashboard with Bar and Line Graphs
Illustrated Europe Map with Data Insights for Political Analysis
Digital Interface with Financial Data Projections
Premium
Composition of dna strand over binary coding data processing. Global science, computing and data processing concept digitally generated video.
Rising Graph over Cityscape Symbolizing Global Business Growth
Digital Financial Data Chart with Dynamic Analytics Graphs
Digital Financial Graph Analysis with Data Interface
Global Financial Data and Digital Trading Interface
Colorful Financial Data Overlay on Cityscape Sky
Innovative DNA and Data Analysis Technology Background
Statistical Financial Data Analysis on Digital Grid
Digital Graphs and Currency Symbols Over Data Servers
Descending Arrow Icons with Colored Bar Graphs on Black Background
Rising Global Economy with Statistics and Financial Analysis
Futuristic Financial Data Display with Stock Market Analysis
Digital Financial Data Processing on Circuit Board
Financial Data Overlay with Finnish Flag and Currency Symbols
Dynamic Financial Data Analytics in Digital Office Environment
Analyzing Financial Growth with Data Graphs and Market Indicators
Cityscape with Financial Data and Rising Graphs Forecast
Dynamic Financial Data Display with Global Indicators
Rising Bar and Line Graph on Blue Background Shows Financial Growth
Innovative Mixed Media Cityscape with Data Graphs
Digital Interface with Global Financial Data and Bar Graphs
Futuristic Data Analytics Dashboard with Vibrant Graphs and Charts
Futuristic Financial Chart on Glass Display Showing Growth Trends
Digital Visualization of Global Economics and Politics
Digital Data Visualization on Car Interface Display
Digital Bar and Line Chart with Financial Data Overlay
Premium
Image of dna strand and data processing over caucasian scientist in lab. Global science, computing and digital interface concept digitally generated image.
Financial Data Analytics in a High-Tech Digital Environment
Financial Data Analysis with Ukraine Flag Background
Financial Data Processing Across Global Digital Network
Abstract DNA with Financial and Data Metrics Overlay
Abstract Stock Market Data Innovation with Bar and Line Graphs
Stock Market Data Visuals Analyze Global Economic Trends
Global Business Analytics and Social Media Metrics
Global Data Analytics Overlay with Earth Background
Financial Data Analysis on World Map Background
Futuristic Data Visualization Over Urban Cityscape Skyline
Digital Data Processing with Animated Bar Graphs on Global Scale
Financial Growth Trends Overlaid on Equatorial Guinea Flag
Digital Graphs Display Growth Trends in Data Network
Futuristic Financial Data Visualization Chart and Global Analytics
Colorful Graph with Digital Finance Interface and Data Overlay
Digital Display of Global Financial Data Process
Financial Data Analytics with Interactive Graphs and Charts
Abstract Data Visualization with Graphs over Digital Grid Background
Dynamic Financial Market Data and Graphs on Digital Display
Interactive Financial Dashboard with Bar and Line Graphs
Global Stock Market Trends and Currency Analysis Visualization
Digital Data Visualization with futuristic elements
Financial Graph with Ukraine Flag Highlighting Economic Crisis
Genomic Data and Digital Interface Conceptual Display
Dynamic Stock Market Analysis Numbers and Graphs
Dynamic Financial Data on Digital Display Canvas
Global Financial Data Visualization Overlaying Earth
Global Financial Data Processing with Digital Interface Overlay
Financial Chart Analysis with Market Data Visuals on Black Background
Stock Market Data Analysis with Digital Interface Elements
Digital Stock Market Data with Graphs and Numbers in Hologram Style
Innovative Digital Data Chart Overlaid on Glass Building
Digital Graph Analytics with Currency Symbols in Virtual Background
Digital Stock Market Growth with Data Visualization
Digital Display of Stock Market Data with Neon Elements
Financial Graphs and Data Overlapping Office Background
Data Visualization with Technology Integration and Digital Analytics
Global Financial Data Analysis with Graphs and Currency Chart
Colorful Digital Bar Graph Data Analysis Concept
Digital Projection of Financial Data with Bar Graphs
Abstract Financial Data and Analytics Background
Colorful Bar and Line Charts Analyzing Financial Data Over Dark Background
DNA Strand Overlaying Digital World Map with Data Networks
Dynamic Financial Dashboard with Bar Charts and Trend Lines
Dynamic Financial Chart with Bar Graphs and Currency Analysis
Digital Financial Dashboard with Bar Chart and Trend Lines