- Home >
- Stock Photos >
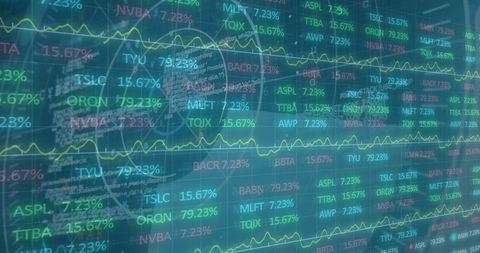
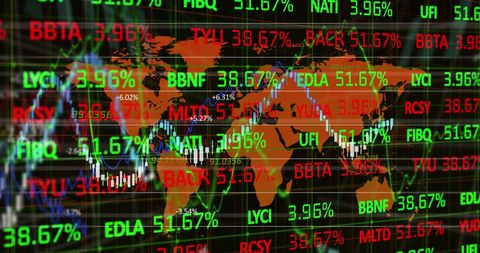
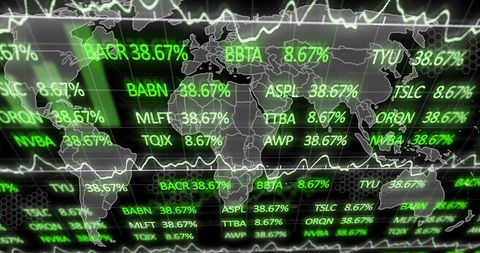
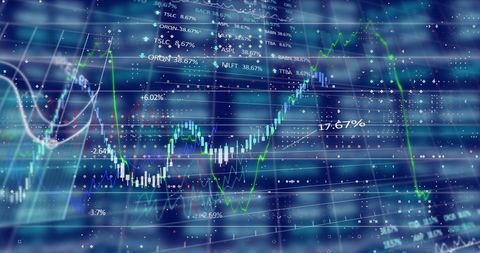
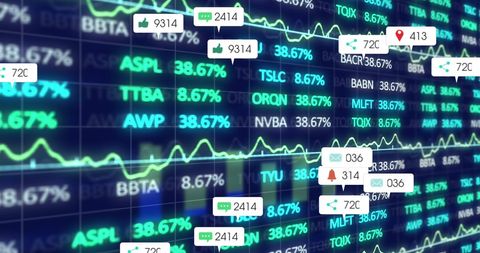
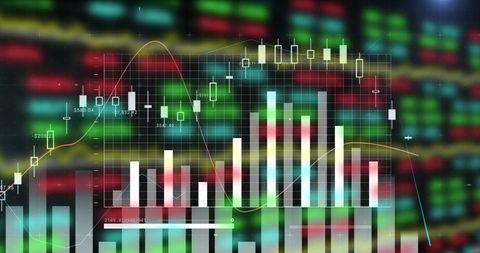
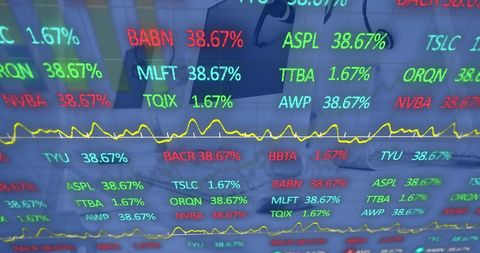
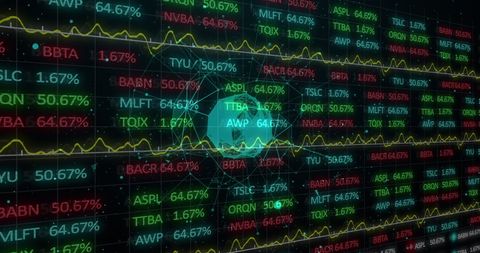
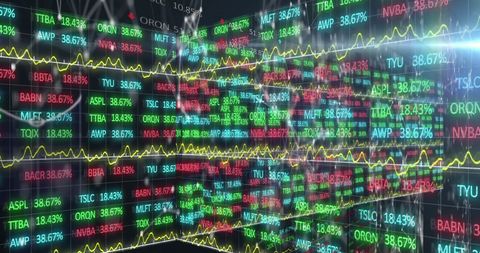
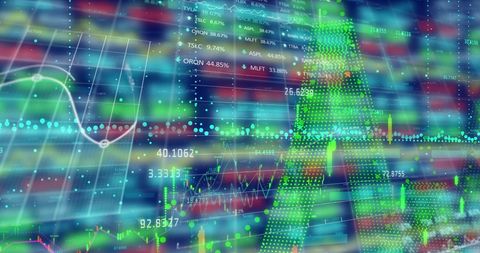
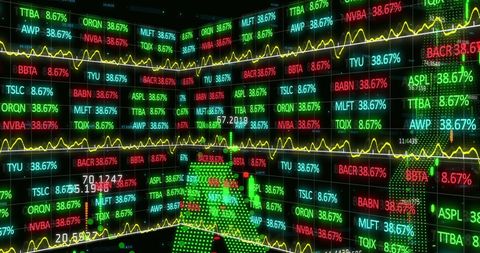
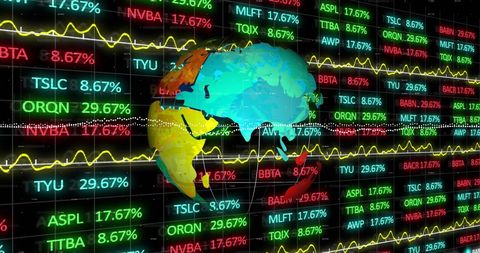
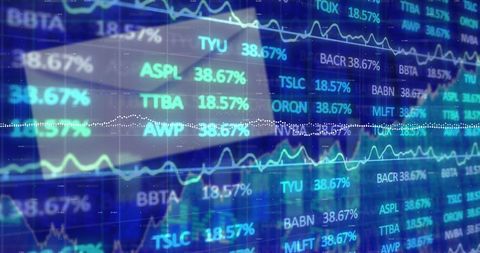
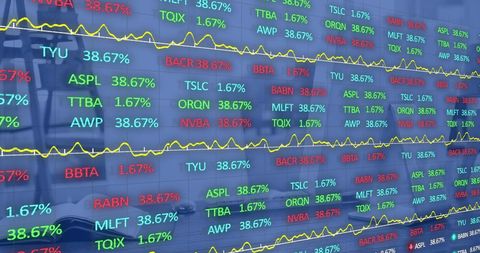
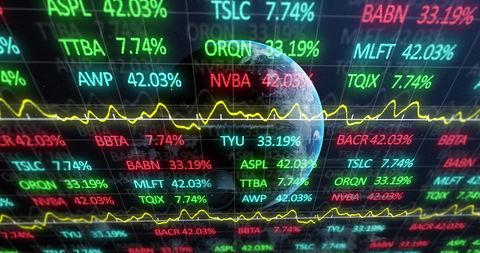
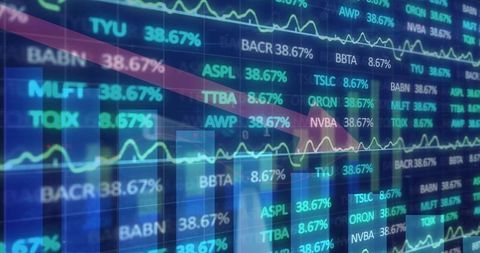
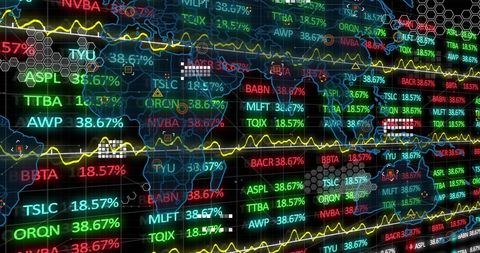
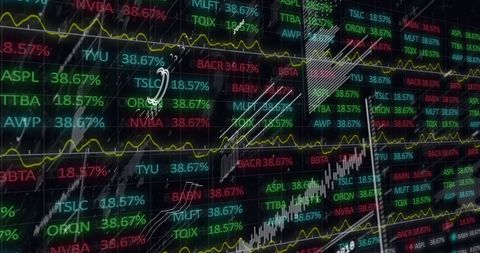
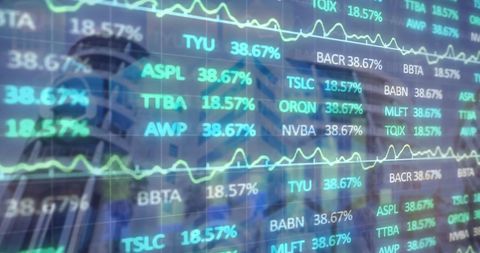
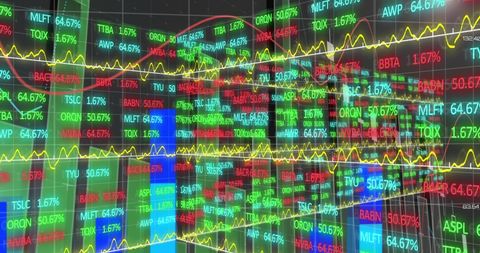
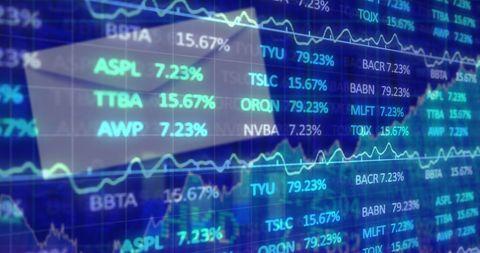
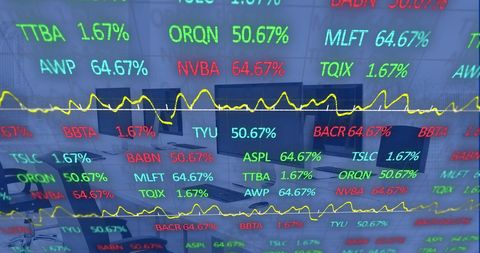
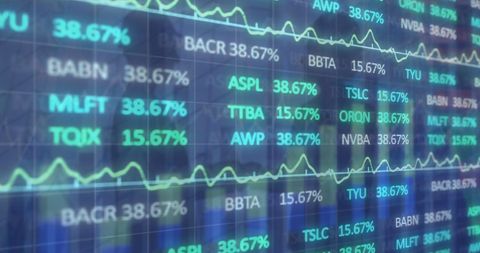
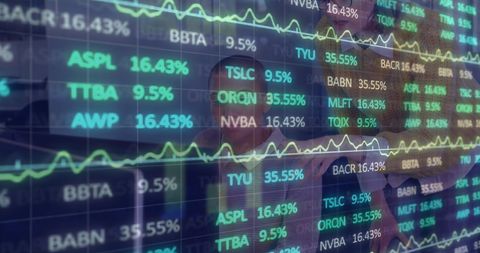
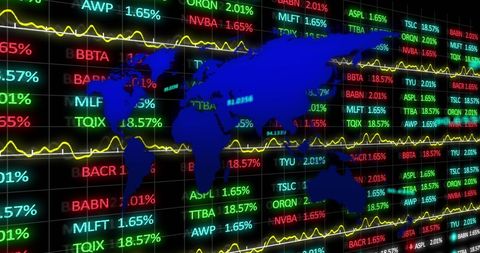
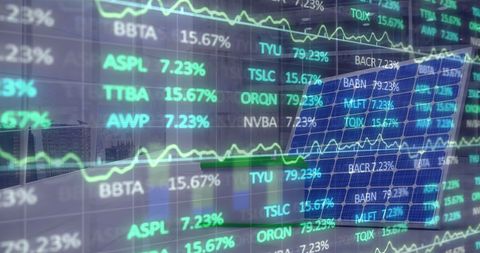
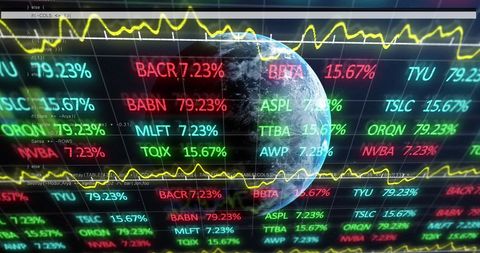
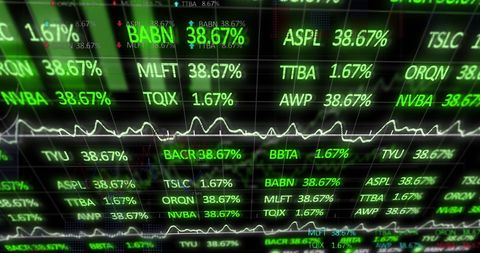
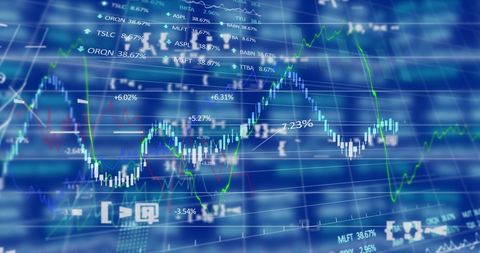
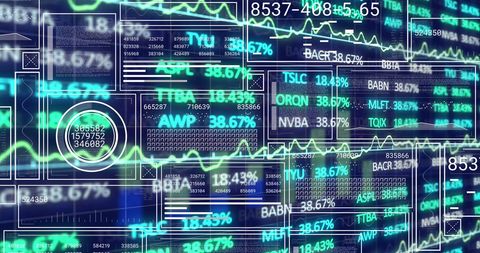
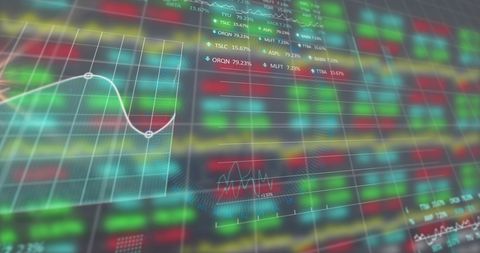
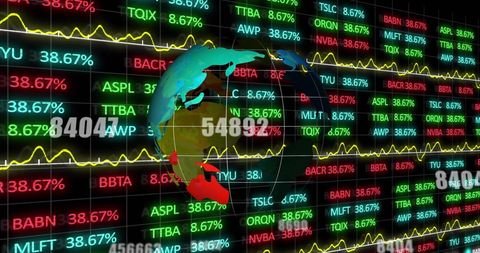
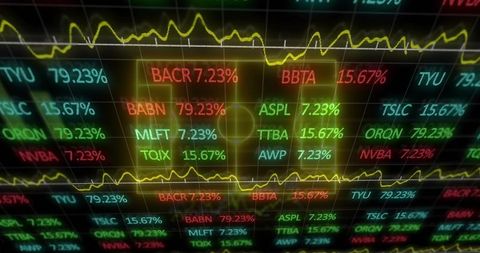
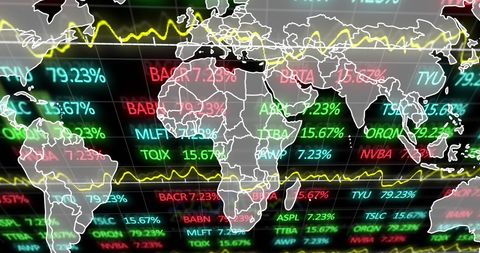
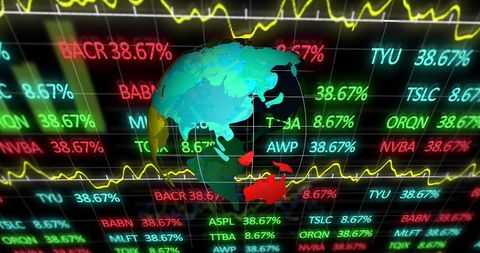
- Digital Data Visualization with Dynamic Financial Charts and Graphs
Digital Data Visualization with Dynamic Financial Charts and Graphs Image
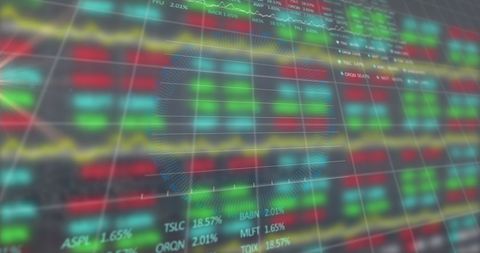
Digital data visualization illustrates dynamic processing of financial trends and market behavior. Green and red columns represent various shifts and statistics crucial for analysis, making it ideal for content focused on finance, analytics, technology, or global business strategies.

downloads
Tags:
More
Credit Photo
If you would like to credit the Photo, here are some ways you can do so
Text Link
photo Link
<span class="text-link">
<span>
<a target="_blank" href=https://pikwizard.com/photo/digital-data-visualization-with-dynamic-financial-charts-and-graphs/97bd6b596e77bcf2568a61e4bf366597/>PikWizard</a>
</span>
</span>
<span class="image-link">
<span
style="margin: 0 0 20px 0; display: inline-block; vertical-align: middle; width: 100%;"
>
<a
target="_blank"
href="https://pikwizard.com/photo/digital-data-visualization-with-dynamic-financial-charts-and-graphs/97bd6b596e77bcf2568a61e4bf366597/"
style="text-decoration: none; font-size: 10px; margin: 0;"
>
<img src="https://pikwizard.com/pw/medium/97bd6b596e77bcf2568a61e4bf366597.jpg" style="margin: 0; width: 100%;" alt="" />
<p style="font-size: 12px; margin: 0;">PikWizard</p>
</a>
</span>
</span>
Free (free of charge)
Free for personal and commercial use.
Author: People Creations