- Home >
- Stock Photos >
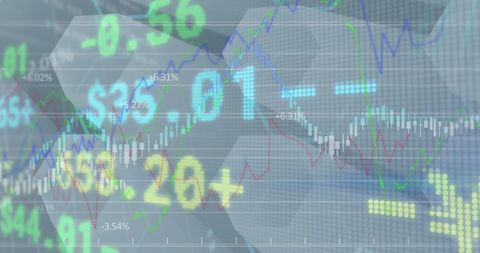
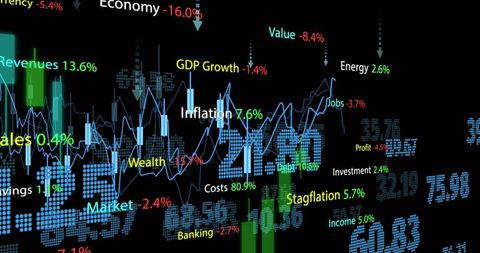
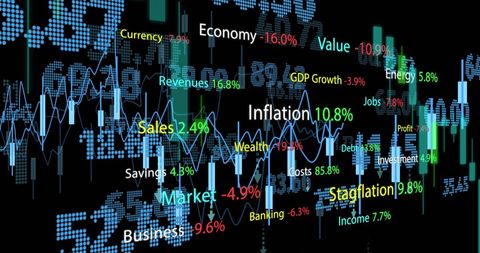
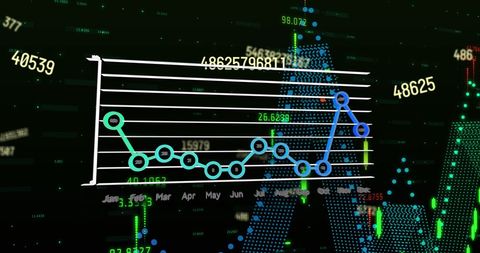
- Digital Data Visualization with Financial Analytics and Metrics
Digital Data Visualization with Financial Analytics and Metrics Image

This illustration depicts dynamic digital data related to financial analytics. Featuring numerical overlays and abstract representations, it highlights core concepts of global business, finance, and technology-driven analysis. Ideal for using in content about market trends, economic studies, and data-driven financial strategies.

downloads
Tags:
More
Credit Photo
If you would like to credit the Photo, here are some ways you can do so
Text Link
photo Link
<span class="text-link">
<span>
<a target="_blank" href=https://pikwizard.com/photo/digital-data-visualization-with-financial-analytics-and-metrics/e25b683ba108d0ebc88e02ae6e0c37a0/>PikWizard</a>
</span>
</span>
<span class="image-link">
<span
style="margin: 0 0 20px 0; display: inline-block; vertical-align: middle; width: 100%;"
>
<a
target="_blank"
href="https://pikwizard.com/photo/digital-data-visualization-with-financial-analytics-and-metrics/e25b683ba108d0ebc88e02ae6e0c37a0/"
style="text-decoration: none; font-size: 10px; margin: 0;"
>
<img src="https://pikwizard.com/pw/medium/e25b683ba108d0ebc88e02ae6e0c37a0.jpg" style="margin: 0; width: 100%;" alt="" />
<p style="font-size: 12px; margin: 0;">PikWizard</p>
</a>
</span>
</span>
Free (free of charge)
Free for personal and commercial use.
Author: Authentic Images