
- Home >
- Stock Photos >
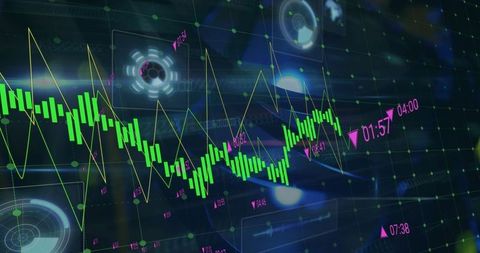
- Digital Data Visualization with Financial Charts in Technology Interface
Digital Data Visualization with Financial Charts in Technology Interface Image

This abstract representation of digital data processing features a circular interface overlaying various financial graphs. It is ideal for illustrating concepts in finance technology, data analytics, stock market trends, and digital innovations. Suitable for use in presentations, financial reports, software applications, and websites focused on data science, cryptocurrency, and fintech sectors.
Powered by 


downloads
Tags:
More
Credit Photo
If you would like to credit the Photo, here are some ways you can do so
Text Link
photo Link
<span class="text-link">
<span>
<a target="_blank" href=https://pikwizard.com/photo/digital-data-visualization-with-financial-charts-in-technology-interface/ce2277cad283e237f6b30ca1e372f0fd/>PikWizard</a>
</span>
</span>
<span class="image-link">
<span
style="margin: 0 0 20px 0; display: inline-block; vertical-align: middle; width: 100%;"
>
<a
target="_blank"
href="https://pikwizard.com/photo/digital-data-visualization-with-financial-charts-in-technology-interface/ce2277cad283e237f6b30ca1e372f0fd/"
style="text-decoration: none; font-size: 10px; margin: 0;"
>
<img src="https://pikwizard.com/pw/medium/ce2277cad283e237f6b30ca1e372f0fd.jpg" style="margin: 0; width: 100%;" alt="" />
<p style="font-size: 12px; margin: 0;">PikWizard</p>
</a>
</span>
</span>
Free (free of charge)
Free for personal and commercial use.
Author: Creative Art
Similar Free Stock Images

Premium


Premium


Premium


Premium


Premium


Premium


Premium


Premium


Premium


Premium


Premium

Premium


Premium

Premium


Premium


Premium


Premium


Premium

Premium

Premium


Premium


Premium


Premium


Premium

Premium


Explore More Free Stock Images