1. Home > 
  2. Stock Photos > 
  3. Digital Data Visualization with futuristic elements

Digital Data Visualization with futuristic elements Image

Digital Data Visualization with futuristic elements

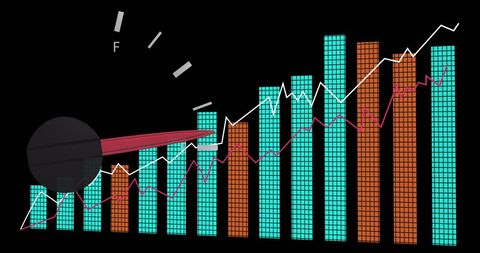
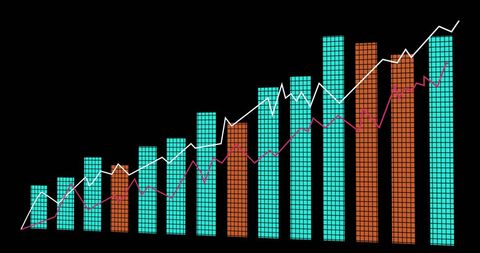
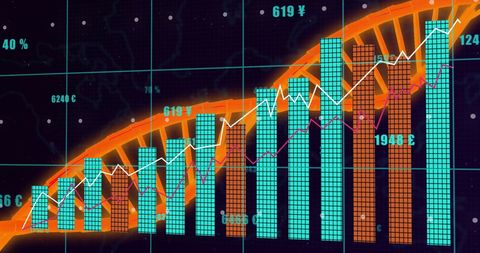
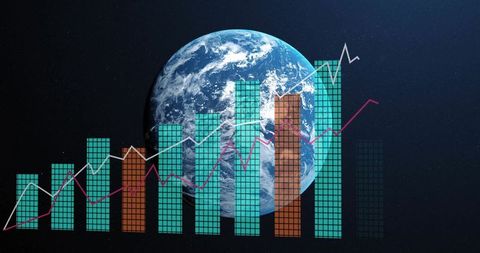
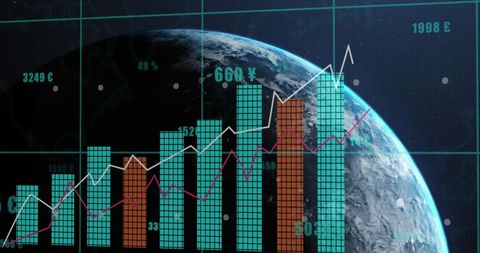
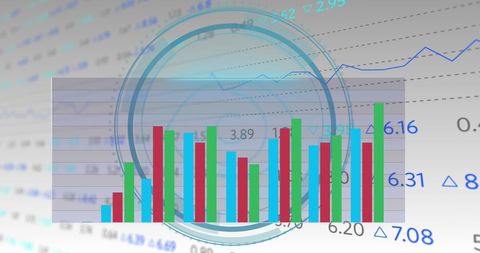
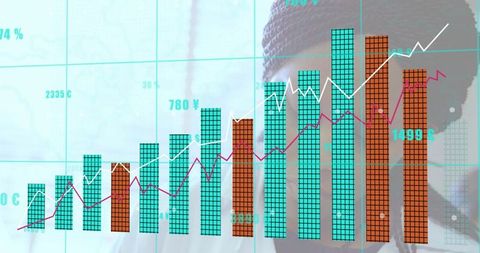
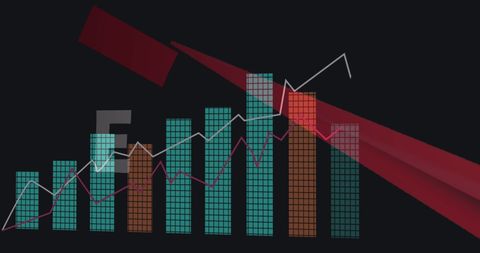
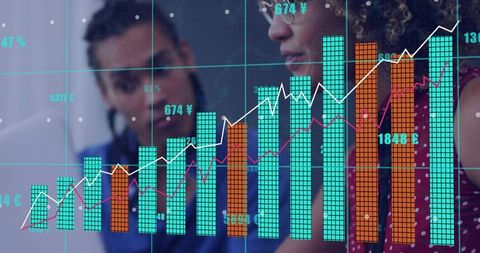
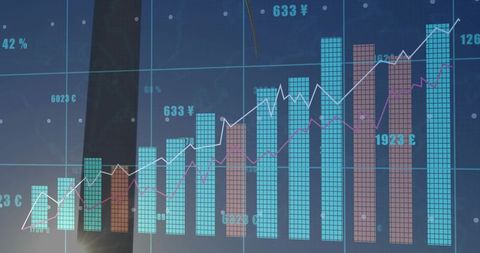
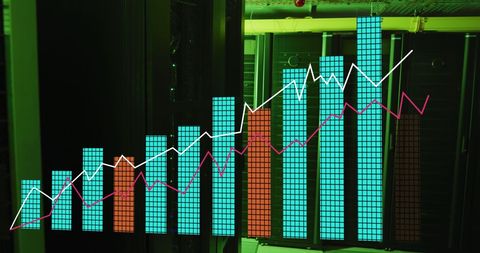
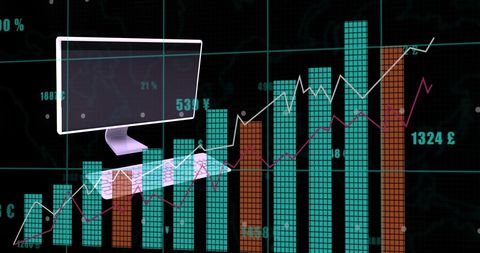
Digital display illustrates complex data visualization. Futuristic overlays incorporate bar and line graphs signifying analytics and financial predictions. Useful in technology-focused design, finance reports, and educational materials for effective communication of statistical information.

Powered by Shutterstock logo - Get 15% off with code: PIKWIZARD15
KPI data analytics concept, Key performance indicator analysis system. Information technology digital software management. Visualization tech solution. Business artificial intelligence. AI dashboard. - Powered by Shutterstock - Get 15% off with code: PIKWIZARD15Man presenting market data to seated woman using laptop, team collaborates on visual analytics for digital product strategy and UX improvement in creative tech workspace. - Powered by Shutterstock - Get 15% off with code: PIKWIZARD15Close-up of hands working with AI-powered business dashboard showing project timelines, progress bars, charts, and analytics for data-driven management. - Powered by Shutterstock - Get 15% off with code: PIKWIZARD15Data-driven decision-making empowers business through analytics, datum collection, and AI systems. Data driven tools support cloud data processing and data visualization across datum platforms. Spline - Powered by Shutterstock - Get 15% off with code: PIKWIZARD15Bold artwork. Group of doctors analyzing holographic brain projection with collaborative emotion. Concept of teamwork, neuroscience, healthcare branding, education, and digital innovation in medicine. - Powered by Shutterstock - Get 15% off with code: PIKWIZARD15

Credit Photo

If you would like to credit the Photo, here are some ways you can do so

Free (free of charge)

Free for personal and commercial use.

Author: Awesome Content

Similar Free Stock Images

Futuristic Data Processing with Bar Graph and Digital Interface
Premium
Data flow from database and cloud to processing and analytics dashboards, representing data analysis, automation, insight generation, and digital intelligence Vouch
Global Financial Data Analysis with Graphs and Currency Chart
Data Processing Over Car Panel with Graph Lines and Charts
Rising Bar and Line Graph on Blue Background Shows Financial Growth
Interactive Financial Dashboard with Bar and Line Graphs
Digital Graph Analytics with Currency Symbols in Virtual Background
Digital Bar and Line Chart with Financial Data Overlay
Economic Inflation Trends with Rising Data Graph Representation
Rising Multi-Series Financial Bar Chart Showing Trend Lines on Glass Dashboard
Digital Graphs and Currency Symbols Over Data Servers
Digital COVID-19 Data With Graphs and Charts
Premium
Projecting holographic globe with network nodes in data center corridor, with server racks and LEDs. Technology, network, futuristic, digital, visualization, infrastructure, innovation
Colorful Financial Graph Showing Market Volatility
Data Analytics Concept with Bar Graph and Rising Trend Line
Futuristic Dashboard with Fuel Gauge and Data Visualization
Rising Graph over Cityscape Symbolizing Global Business Growth
Premium
Standing football player wearing helmet, shoulder pads on green grid, with bar charts, line graphs. Athlete, data visualization, technology, sports analytics, futuristic, motion, performance
Colorful Bar and Line Charts Analyzing Financial Data Over Dark Background
Displaying financial growth with teal and orange bar charts on corporate dashboard
Business Growth Graph in Modern Empty Office Background
Descending Arrow Icons with Colored Bar Graphs on Black Background
Premium
Scanning business-casual IT tech holding phone, viewing AR charts amid server racks, copy space. Technology, data, visualization, innovation, analytics, futuristic, professional
Digital Financial Graph Analysis with Data Interface
Dynamic Stock Market Chart Overlay with Financial Data Visuals
Digital Data Processing with Statistical Charts
Rising teal bar with dual-line market dashboard showing trading analytics and growth trends
Digital Financial Data Analyzing on Computer in Global Markets
Financial Growth Trends Overlaid on Equatorial Guinea Flag
Futuristic Data Analytics Visualization with Graph and DNA Strand
3D Bar Chart with Futuristic Analytics Grid and Trend Arrow
Financial Data Analysis with Ukraine Flag Background
Social Media Engagement Icons Overlaying Data Graph
Financial Graph with Ukraine Flag Highlighting Economic Crisis
Analyzing Financial Growth with Data Graphs and Market Indicators
Professional Analyzing Data Graphs in Server Room Environment
Digital Finance Graphs Showing Market Trends
Digital Data Analytics Showing Bar Graph and Curves on Black Background
Premium
Showing dashboard plotting line and bar charts on blue grid, with world map and numeric overlays. Analytics, visualization, data, technology, finance, dashboards, growth
Premium
Data insights, charts, and analytics help visualize performance. Data drives strategy, analytics enhances growth, and data improves business outcomes through analytics. Vouch
Premium
A close-up view of a hand interacting with a digital tablet displaying various data visualizations, ideal for exploring business analytics and technology.
Innovative Mixed Media Cityscape with Data Graphs
Global Economic Data Trends with Rotating Earth and Graphs
Financial Chart Analysis with Market Data Visuals on Black Background
Financial Data Analytics in a High-Tech Digital Environment
Digital Data Visualization on Car Interface Display
Retro Gaming Concept Over Financial Charts with Red Arrow
Dynamic Financial Data Analytics in Digital Office Environment
Premium
Displaying dashboard on screen, showing world map, pie charts, candlestick bars, bubble showing 58. Technology, data visualization, business intelligence, digital interface, analytics, dashboard,
Abstract Financial Data Analysis with Bar and Line Graphs
Digital Display of Global Financial Data Process
Colorful Graph with Digital Finance Interface and Data Overlay
Digital Financial Growth with Rising Bar and Line Graphs
Premium
Visualizing central data analytics on digital interface, with pie charts bar graphs formulas. Futuristic, technology, visualization, infographics, digital, scientific, analytical
Futuristic Financial Chart on Glass Display Showing Growth Trends
Global Financial Growth Trends Visualization with Data Graphs
Economic Decline in Czech Republic with Financial Graphs
Innovative Digital Data Chart Overlaid on Glass Building
Premium
Dynamic digital equalizer and waveform display on a dark background, illustrating audio processing, sound visualization, or data analysis with glowing lines and abstract patterns.
Rising Global Economy with Statistics and Financial Analysis
Digital Financial Analysis Dashboard with Bar and Line Graphs
Futuristic Financial Data Visualization Chart and Global Analytics
Futuristic Financial Growth Chart Over Urban Nightscape
Business Analytics Graphs Overlaid on Data Center Servers
Businessman Analyzing Complex Digital Data Interface
Premium
AI transforms how we manage digital data. From smart indexing to AI-driven search, file handling becomes intelligent. AI file management improves speed, accuracy, and data organization. Muxer
Premium
Businessman using AI technology on software ready to use robot to create or analyze data and big data technology. Business analysis and visualization of complex data sets on computer on computer
Premium
Conceptual visual of data analysis with black woman working in the office
Soaring Follower Count with Digital Data Growth Indicators
Statistical Financial Data Analysis on Digital Grid
Digital Graph Illustrating Financial Data Analysis Trends
Digital Data Visualization with DNA Strand Overlaying Graphs
Premium
Medical professional interacting with holographic interface for patient monitoring and AI-assisted health data visualization in smart healthcare system
Digital Interface with Global Financial Data and Bar Graphs
Retro Gaming Concept with Declining Economical Chart
Digital Interface Displaying Cybersecurity Data Charts Analysis
Global Business Analytics and Growth Concept Hologram
Premium
A hand interacts with glowing holographic data graphs and charts, showcasing futuristic digital visualization on a dark background. Concept of innovation
Digital Financial Market Trends and Data Visualization
Financial Data and Stock Market Decline Visualization
Futuristic Financial Analytics with Data Charts and Graphs
Digital Financial Data Graph Display Over Global Network
Premium
Woman standing arms crossed and smiling in office, digital screen showing pie charts and bar graphs. Professional, executive, corporate, data visualization, analytics, presentation, leadership
Colorful Digital Bar Graph Data Analysis Concept
Global Finance Analytics with Rising and Falling Charts
Dynamic Financial Chart with Bar Graphs and Currency Analysis
Futuristic Data and Financial Analysis in Modern Office Environment
Premium
Global AI and data processing system enhances data, AI, and processing efficiency through digital network and global integration of intelligent technology Vouch
Bar and Line Chart Displaying Business Growth in Office Lounge
Colorful 3D Bar Graph with Digital Interface Elements
Data Analytics Concept with Financial Growth Chart in Digital Interface
Global Data Analytics with Futuristic Charts Over Earth
Premium
A developer holding a glowing hologram of an SQL database schema with relational tables and links, illustrating data modeling, system architecture, and modern database management for IT solutions.
Premium
A businessman in a suit actively engages with a digital interface showcasing various data visualizations and analytics, representing modern technology in business.
Financial Data Visualization with Futuristic Bars and Lines
Digital Healthcare Data Visualization with Virus Cells During Pandemic
Digital Financial Dashboard with Bar Chart and Trend Lines
Analysts analyzing financial dashboard with turquoise orange bar charts and line trends
Digital Data Processing with Animated Bar Graphs on Global Scale
Dynamic Data Processing with Digital Interface Elements
Global Financial Data Processing with Digital Interface Overlay
Digital Interface with Financial Data Projections
Abstract Digital Interface Financial Data Bars and Lines
Futuristic 3D Bar and Line Graph Illustration for Data Analytics
Financial Growth Charts Overlaying Urban Cityscape By Day
Premium
Digital Compliance Quality concept with a businessman holding glowing virtual chart in his palm, showing rising financial data, analytics icons, and investment growth for corporate success.
Financial Data Processing Over Cityscape Digital Interface
Premium
Displaying teal dashboard centered on grid, showing HUD icons and dotted line graph trending upward. Analytics, visualization, interface, data, trend, insight, futuristic
Financial Market Trends on Russian Flag Background
Stock Market Data Visuals Analyze Global Economic Trends
Global Financial Data and Digital Trading Interface
Global Financial Data Visualization Overlaying Earth
Premium
Doctor using AI technology with digital data analytics, medical icons, and futuristic interface, representing healthcare innovation, telemedicine, big data in medicine, and smart health solutions.
Digital Graphs Overlaying Advanced Data Server Infrastructure
Neon data viz showing glowing vertical grid bars with white and magenta trend lines
Dynamic Financial Dashboard with Bar Charts and Trend Lines
Futuristic Data Dashboard with Bar Charts and Trend Lines
Premium
Hands typing on a laptop overlaid with a global map and digital icons, symbolizing global business, cybersecurity, cloud computing, data security, and international networking.
Dynamic Financial Data Display with Global Indicators
Data Visualization with Technology Integration and Digital Analytics
Financial Data Analytics with Interactive Graphs and Charts
Premium
Impatient engineer with paraplegia in data center annoyed by slow AI node tree software. Upset server hub worker with disability frustrated by buggy visual programming tool, camera A
Premium
Displaying dashboard showing pie, bar, line and candlestick charts with percentage labels on screen. Futuristic, analytics, technology, innovation, data, interface, visualization
Dynamic Financial Data Visualized Over Warehouse Background
Financial Graphs and Data Overlapping Office Background
Explore More Free Stock Images