
- Home >
- Stock Photos >
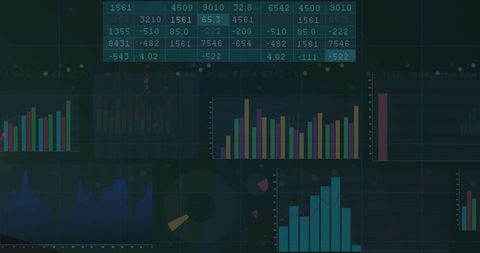
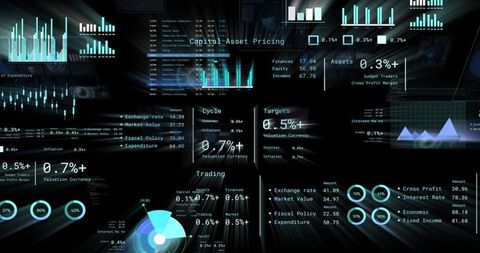
- Digital Data Visualization with Geometric and Analytical Charts
Digital Data Visualization with Geometric and Analytical Charts Image

Combination of colorful bar charts, line graph, mathematically themed sketches and data tables presents rich digital analytics. Ideal for use in tech presentations, educational materials for data visualization and analytics courses, or design projects involving digital and scientific themes.
Powered by 


downloads
Tags:
More
Credit Photo
If you would like to credit the Photo, here are some ways you can do so
Text Link
photo Link
<span class="text-link">
<span>
<a target="_blank" href=https://pikwizard.com/photo/digital-data-visualization-with-geometric-and-analytical-charts/bc001634d2833b0a80dfa8f02433f1cf/>PikWizard</a>
</span>
</span>
<span class="image-link">
<span
style="margin: 0 0 20px 0; display: inline-block; vertical-align: middle; width: 100%;"
>
<a
target="_blank"
href="https://pikwizard.com/photo/digital-data-visualization-with-geometric-and-analytical-charts/bc001634d2833b0a80dfa8f02433f1cf/"
style="text-decoration: none; font-size: 10px; margin: 0;"
>
<img src="https://pikwizard.com/pw/medium/bc001634d2833b0a80dfa8f02433f1cf.jpg" style="margin: 0; width: 100%;" alt="" />
<p style="font-size: 12px; margin: 0;">PikWizard</p>
</a>
</span>
</span>
Free (free of charge)
Free for personal and commercial use.
Author: People Creations
Similar Free Stock Images

Premium


Premium

Premium


Premium

Premium


Premium

Premium


Premium

Premium

Premium


Premium

Premium


Premium


Premium


Premium


Premium


Premium


Premium

Premium


Premium


Premium


Premium


Premium


Premium


Premium


Explore More Free Stock Images